Clear Sky Science · en
Tile-drainage and Crop Rotation Enhanced Cropland Dataset to Improve Spatial Accuracy of Eco-hydrologic Models
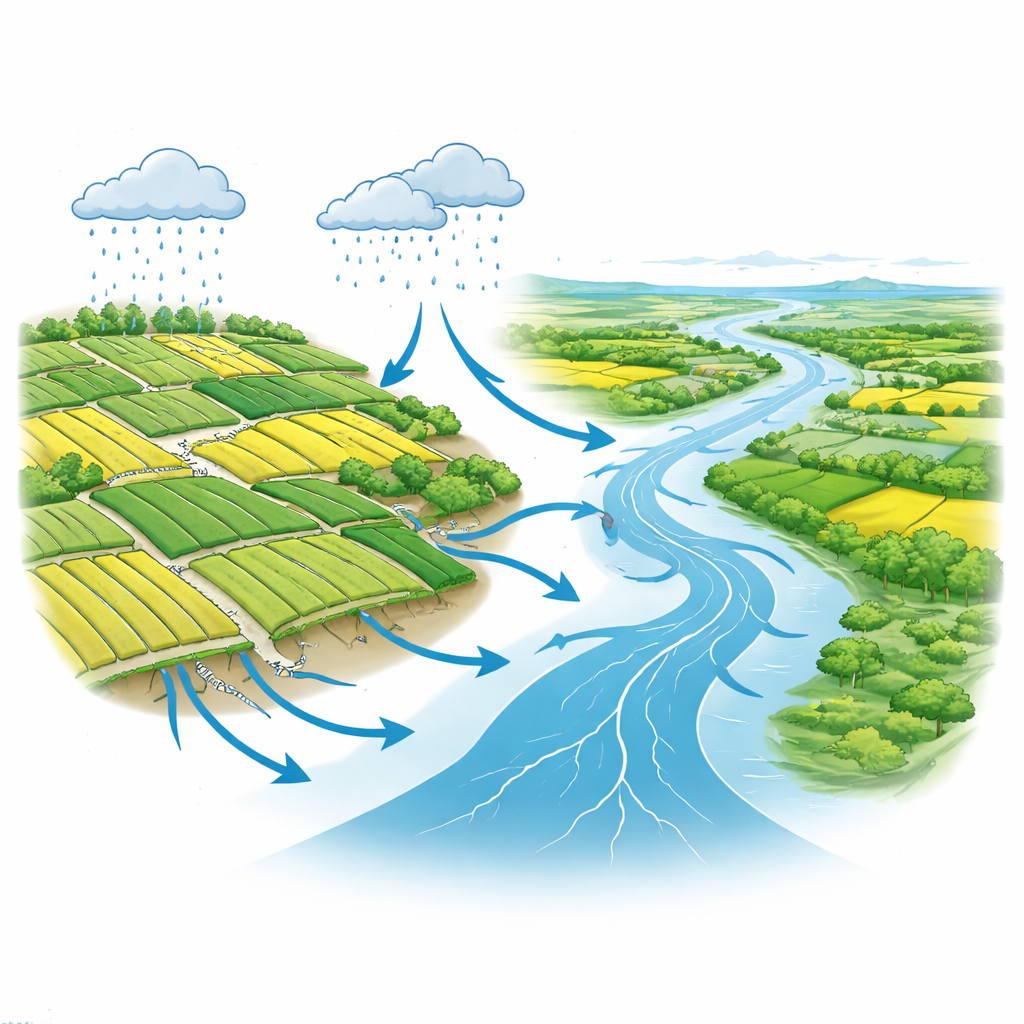
Farming, Hidden Pipes, and Downstream Waters
Across the American Midwest, corn and soybean fields are crisscrossed not just by tractors but by invisible pipes buried underground. These drains quietly move huge volumes of water—and the fertilizer it carries—into streams and rivers. This paper introduces a new, more detailed map of U.S. cropland that helps scientists and planners better understand how these hidden systems shape flooding, crop yields, and water pollution, laying the groundwork for smarter conservation and farm policy.
Why Better Maps of Fields Matter
Computer models are now essential tools for answering questions like “How much fertilizer reaches the river?” or “Will this practice reduce flooding?” These eco-hydrologic models depend on digital maps that describe what is growing on every field and how water moves through the soil. Existing national maps show broad land-cover types and individual crops year by year, but they miss two key realities of modern row-crop farming: the way farmers rotate crops over many seasons, and where underground tile drains have been installed. Without those details, models tend to smear out where water and nutrients really move, weakening their usefulness for local decisions.
A Sharper Picture of Drained Farmland
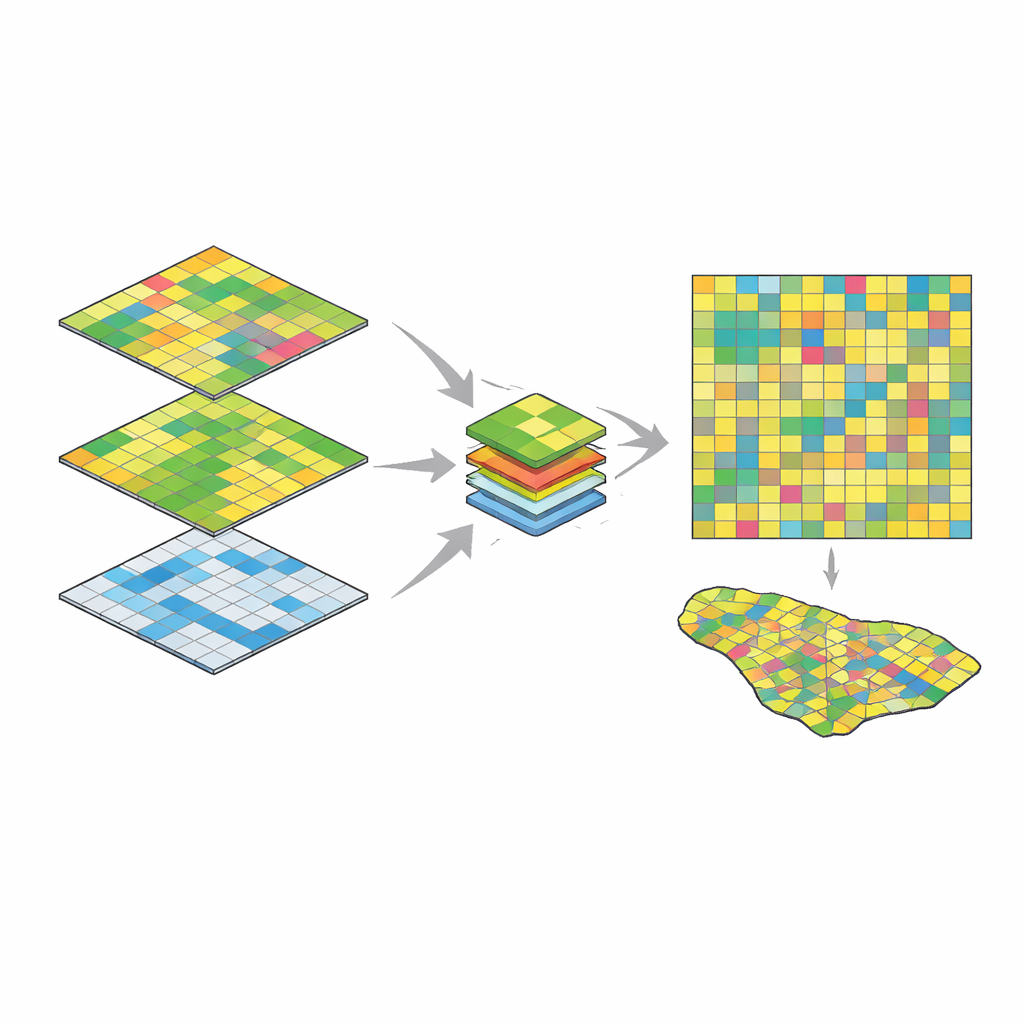
The authors created a new 30-meter resolution product called the Tile-drainage and Rotation-Enhanced Cropland (TREC) dataset for the entire contiguous United States. They started from three publicly available building blocks: the USDA’s high-resolution Cropland Data Layer, multi-year “frequency” layers that show how often key crops like corn, soybeans, wheat, and cotton appear in the same place over 17 years, and a national map of tile-drained croplands. By combining these layers, they assigned each pixel not just a crop type, but also whether that crop is grown almost continuously over time and whether the field is likely drained by underground tiles.
How the New Map Is Built
To separate long-term rotations from more varied fields, the team examined crop frequency: if a pixel grew a given crop in at least 14 out of 17 years (more than 80% of the time), it was tagged as “continuous” for that crop. This step helped avoid mislabeling fields that temporarily switched crops or were misclassified by satellites. Next, they overlaid the national tile-drainage map, which uses soil wetness, slope, and county statistics to estimate where underground pipes are installed. Each cropland pixel was then recoded to indicate both its rotation pattern and whether it is tile-drained, producing the TREC layer—a single, compact map that encodes the intensity of cropping and the presence of subsurface drainage for every agricultural pixel.
Putting the Map to the Test
To see whether this extra detail actually improves modeling, the researchers ran an advanced watershed model (SWAT+) in two Midwestern test beds: Iowa’s Boone River watershed, where tile drains are dense and widespread, and a large portion of southern Minnesota, where drainage is patchier. They compared results using the traditional cropland map versus TREC, keeping all other model settings fixed and deliberately avoiding calibration tricks. Overall water budgets and crop yields were nearly identical between the two setups, showing that TREC did not distort basic behavior. But when they looked at where tile flow was simulated and how well streamflow patterns matched U.S. Geological Survey records, the TREC-based runs did better: efficiency scores improved, and tile flow was concentrated in places that independent drainage maps say should be heavily drained.
Sharper Tools for Cleaner Water and Resilient Farms
The study concludes that simply giving models a more realistic picture of which fields are tiled and continuously cropped leads to more believable patterns of water movement, even before any tuning of model parameters. TREC does not magically remove all uncertainty—its inputs and assumptions still carry errors, and it reflects conditions near 2017 rather than future changes. But by packaging crop rotations and tile drainage into one, easy-to-use, public dataset, it offers a stronger backbone for studies of nutrient runoff, conservation targeting, and climate resilience in U.S. agriculture. For decision-makers, that means model results that better reflect where problems and opportunities actually lie on the landscape.
Citation: Mamidala, R., Liu, L. Tile-drainage and Crop Rotation Enhanced Cropland Dataset to Improve Spatial Accuracy of Eco-hydrologic Models. Sci Data 13, 321 (2026). https://doi.org/10.1038/s41597-026-06693-7
Keywords: tile drainage, crop rotation, watershed modeling, water quality, corn belt agriculture