Clear Sky Science · en
Pedestrian Trajectory Dataset of Public European Squares
Why watching people walk can reshape our cities
How people move through plazas and town squares says a lot about how welcoming and well-designed those places are. Yet most of what we know about everyday walking patterns comes from small studies or one-off experiments. This article presents a large, openly shared dataset that traces the paths of hundreds of thousands of pedestrians crossing public squares across Europe, offering city planners, researchers, and designers a new way to understand how public spaces really work.
Bringing many town squares into one shared view
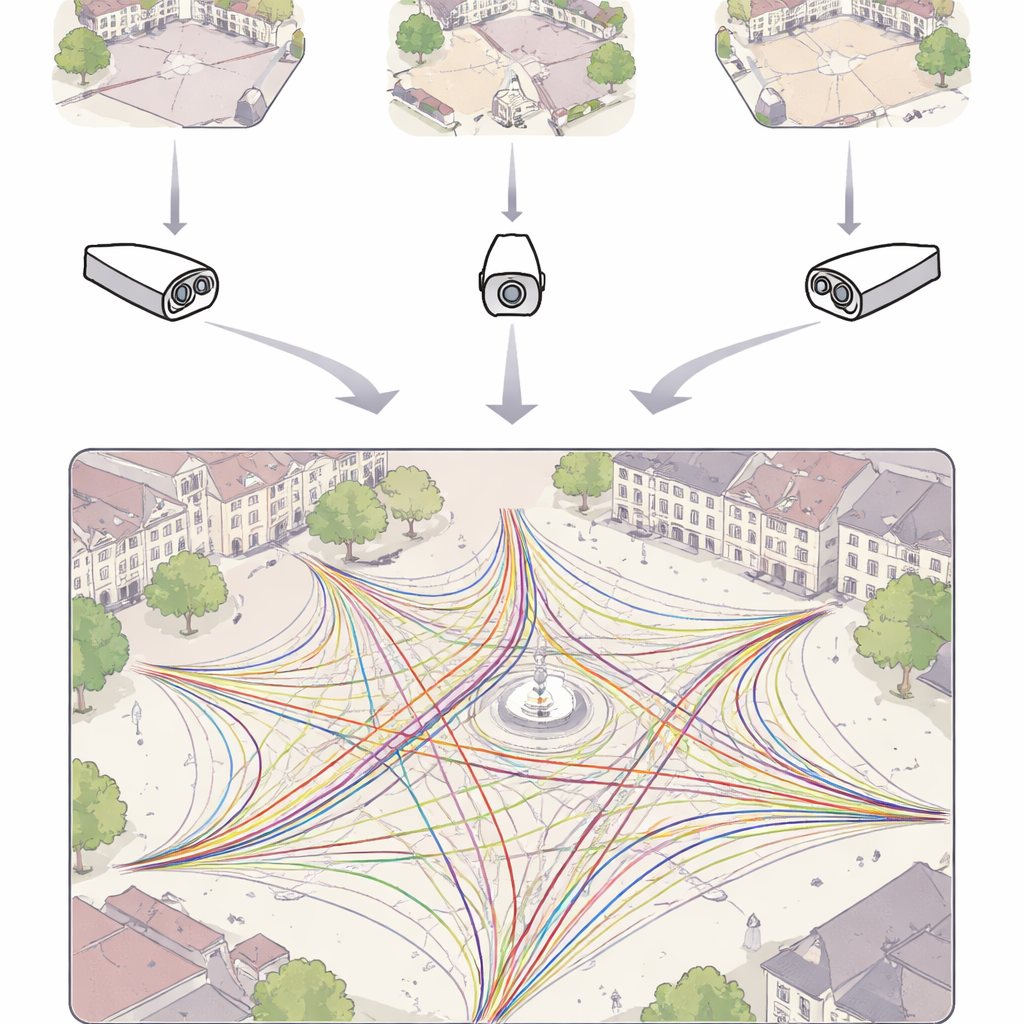
The authors focused on a familiar setting: the central squares of European towns and cities. These are places where people stroll, meet friends, sit by fountains, or cross on their way to work. Instead of sending survey teams into the field, the researchers tapped into a growing resource that already watches these spaces around the clock—public webcams. They systematically searched international webcam platforms for cameras that clearly showed a square, had smooth video and a decent frame rate, and could be recorded reliably. In total, they gathered 193 hours of footage from 39 squares, usually in four half-hour clips that captured morning, lunchtime, evening, and a busy Saturday, and they added extra recordings for four squares across different seasons and weather conditions.
Turning raw video into trails of movement
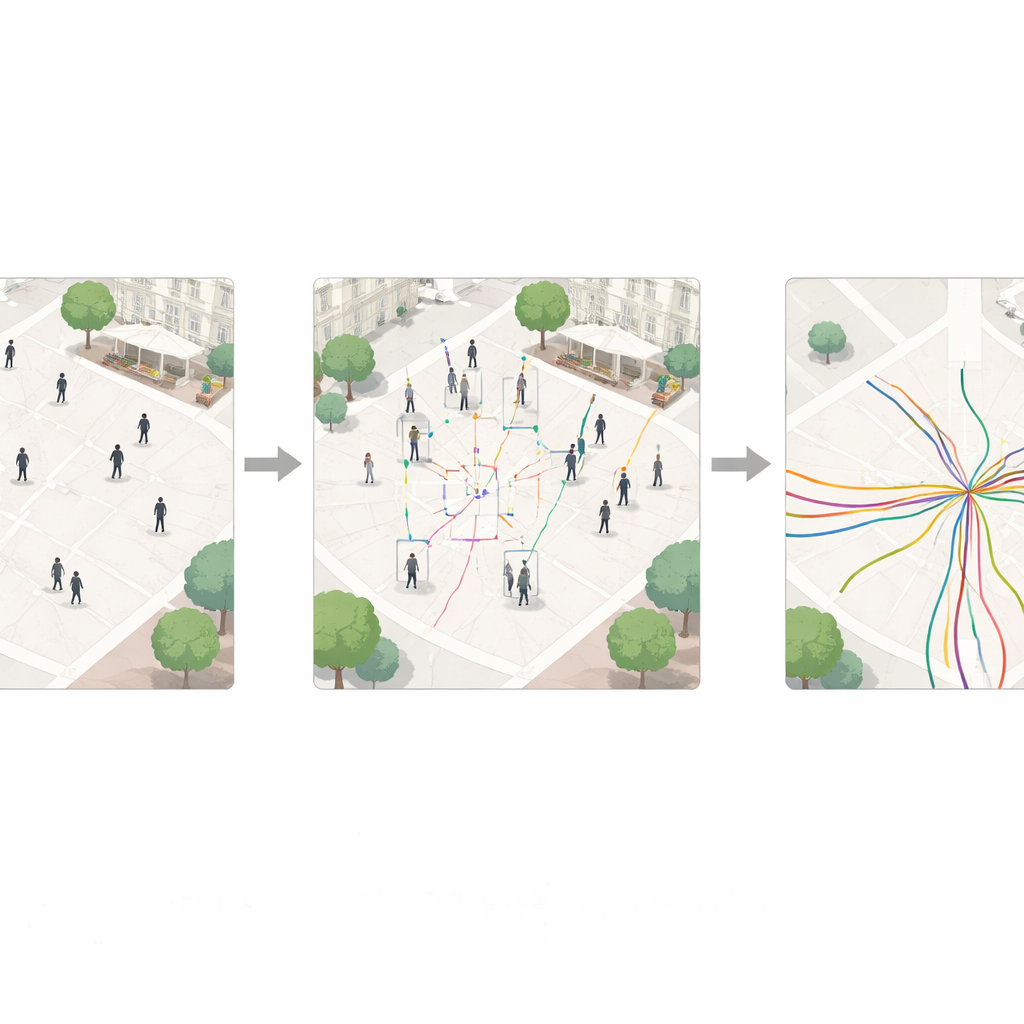
To transform the videos into data, the team used modern computer vision tools that can automatically find and follow people in each frame. First, they applied a cutting-edge detection model that spots human figures in the image. They trained and tuned this model using specialized image collections focused on pedestrians in crowded scenes, improving its ability to pick out people even when they are close together or partially hidden. Then, they linked these detections over time with a tracking algorithm that assigns each person a temporary ID and follows that person as they walk across the square. The result is a time-stamped series of positions for each pedestrian—a digital trail showing where they came from, where they went, and how long they stayed.
From pixels on a screen to real ground underfoot
Seeing a person move across a screen is not the same as knowing how far they walked or how fast they moved. To make the data useful for studying real behavior, the researchers needed to convert screen coordinates into measurements on the ground. Because they did not control the webcams, they lacked detailed information about each camera’s lens and position. Instead, they used a clever workaround: matching features that appear both in the video image and in satellite photos of the same square, such as building corners, trees, or benches. This matching process, known in imaging as using a transformation between two views of the same surface, allowed them to estimate where each pixel lies on the actual plaza surface. With that, they could compute walking speeds, crowd density, and exact paths in meters rather than pixels.
Cleaning, checking, and sharing the data
Automatic methods are never perfect, so the team carried out several steps to tidy and test the data. Very short or obviously noisy trails were removed, and the remaining paths were gently smoothed to avoid jitter. Only points that lay within the true outline of each square were kept, and the data were simplified so that each second of movement is represented by just a couple of points—enough to keep the shape of each path while making the files easier to handle. The authors checked how accurately people were detected in sample frames and found that the vast majority of real pedestrians were correctly identified, with relatively few false alarms. They also examined how consistently individuals were tracked, especially for longer walks, and measured how closely the transformed positions matched known points on the ground for different squares.
What this new resource makes possible
All told, the project released roughly 348,000 pedestrian trajectories, each with an ID, position over time, and basic information like speed, plus weather and contextual data for each recording. For non-specialists, the key takeaway is that we now have an open, standardized map of how people actually use dozens of public squares in everyday life. Urban planners can explore which layouts encourage lingering versus quick crossings, transport analysts can study how people navigate open spaces on their way to buses or trains, and social scientists can examine how weather or time of day shapes public life. While the dataset still reflects the limits of camera-based tracking—such as occasional confusion when people stand still or are hidden from view—it provides a rich, reusable foundation for making public spaces more vibrant, comfortable, and responsive to the ways people really move.
Citation: Wolff, N., Perry, L., Venverloo, T. et al. Pedestrian Trajectory Dataset of Public European Squares. Sci Data 13, 402 (2026). https://doi.org/10.1038/s41597-026-06686-6
Keywords: pedestrian trajectories, public squares, urban mobility, computer vision data, crowd behavior