Clear Sky Science · en
Pan-Arctic sea ice drift data at 400 m grids based on spaceborne SAR
Why the motion of Arctic sea ice matters
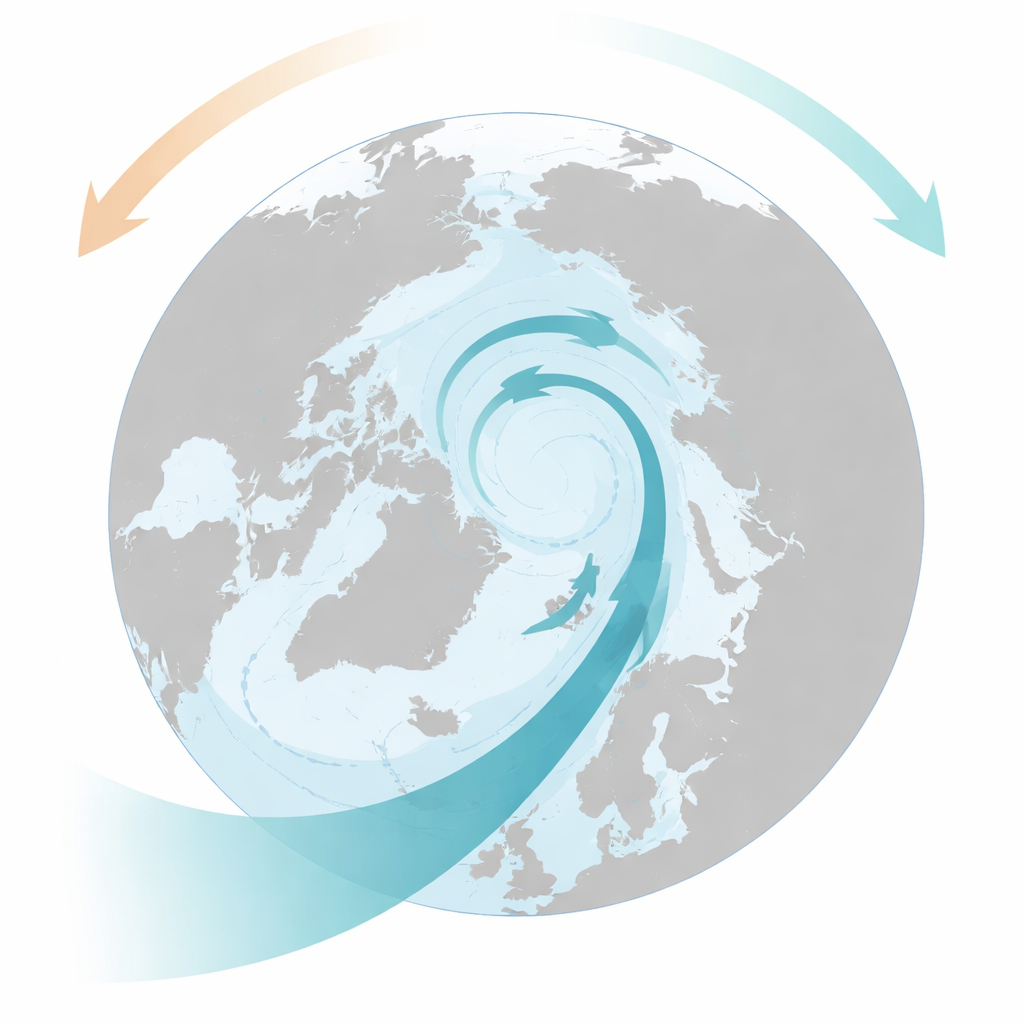
Arctic sea ice is not a frozen, motionless cap. It constantly drifts, cracks, piles up, and escapes the Arctic Ocean. This motion controls how much thick ice is lost to warmer seas, shapes hazards for ships and offshore platforms, and influences the climate system far beyond the poles. Until now, scientists could only see this movement in coarse snapshots, missing the fine details that matter for local safety and for testing modern climate models. This study introduces a new map of Arctic sea ice motion that is sharp enough to resolve features just a few city blocks across, using a clever blend of satellite radar and computer vision techniques.
A sharper look at drifting ice
The authors present the Sea Ice Drift Computer Vision (SID-CV) dataset, a five-year record (2017–2021) of sea ice motion across almost the entire Arctic Ocean. It is built from imagery collected by Europe’s Sentinel-1 radar satellites, which can see Earth’s surface day or night, through clouds and polar darkness. Unlike older products that blur information over tens of kilometres, SID-CV tracks the ice on a grid spaced just 400 meters apart. Every product in the dataset describes how patches of ice moved between two satellite passes separated by up to 36 hours, storing both the direction and distance of drift along with detailed quality information.
From raw radar images to motion maps
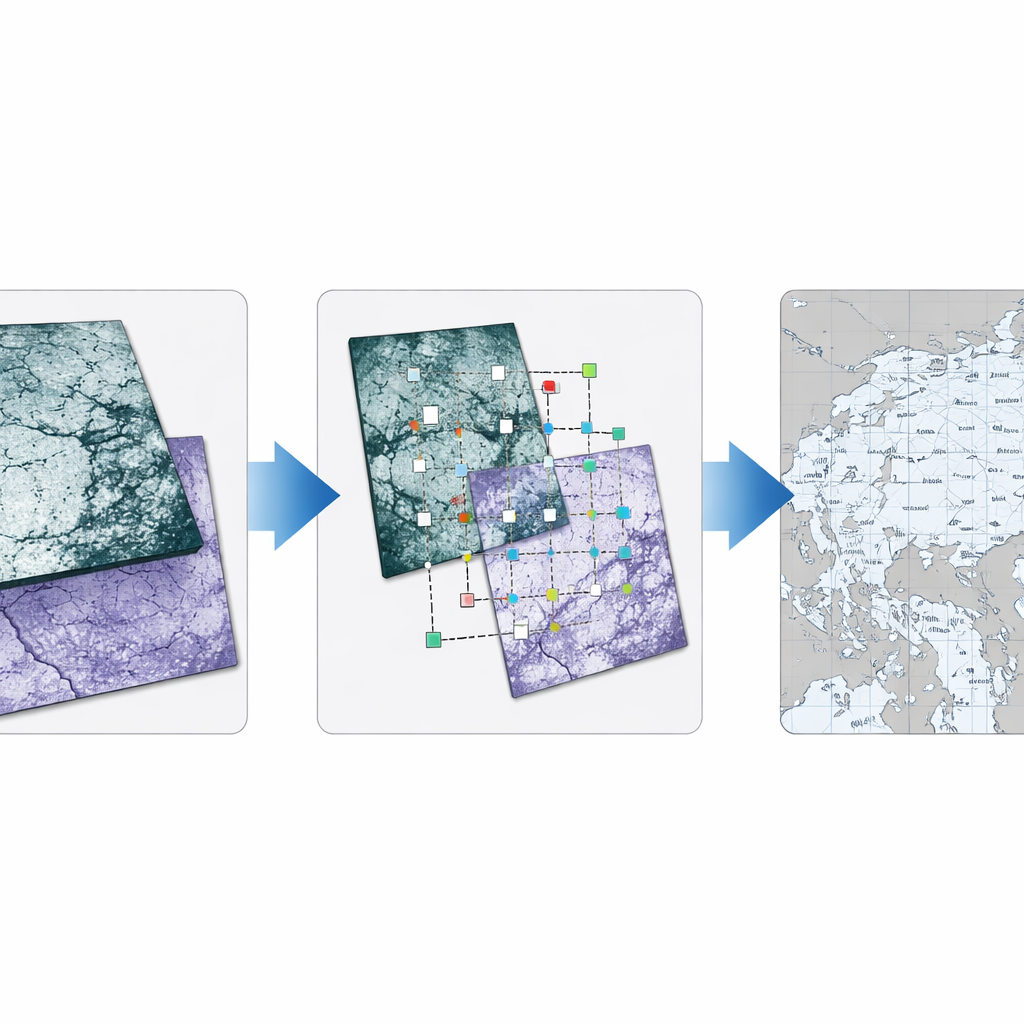
To turn pairs of radar snapshots into a dense motion field, the team adapted tools more familiar from digital photography than from polar research. First, they detect distinctive “features” in the ice pattern, then trace where those features appear in the next image. These matches provide an initial sketch of how the ice has moved. Next, a pattern-matching step refines this sketch across several scales, zooming in from kilometre-sized blocks down to the 400-meter grid. At each stage, the method checks how well small patches of the first image resemble candidate patches in the second. In this way, the computer gradually builds a smooth, detailed picture of ice drift, while preserving the fine textures that radar can reveal.
Keeping only the trustworthy pieces
Not every pixel in a radar image represents drifting ice. Some are land, some are open water, and some are simply too ambiguous to track reliably. The SID-CV system automatically masks out coastlines and open-ocean areas using external shoreline and sea ice maps. It also assigns each ice pixel to one of several quality levels, based on how many features were successfully tracked, how strong the pattern match is, and whether the implied drift speed falls within physically reasonable limits. Rather than discarding uncertain estimates, the dataset keeps them but flags them as “suspect” or “bad,” allowing users to tailor how strict they want to be. On average, more than 94% of records are classified as “good,” meaning the algorithm found clear, consistent motion signals.
Testing the data against real buoys
To check how well the satellite-based motions reflect reality, the authors compared SID-CV with more than 139,000 drift measurements from floating buoys anchored in the ice, collected by several international programs. Each buoy record was matched to the nearest satellite estimate in space and time. The two sets of drift vectors agree extremely well: typical errors in speed are only a few tenths of a centimetre per second, distances are usually within a few hundred meters, and directions differ by just a few degrees. The dataset performs best in winter, when the ice surface is more stable. In summer, melt ponds and surface water make the radar texture less distinct, leading to a slight underestimation of drift. Even then, the errors remain within clearly defined and relatively tight bounds.
What this means for the Arctic’s future
By combining near-complete pan-Arctic coverage with unprecedented detail, SID-CV bridges a long-standing gap between coarse satellite products, local buoy records, and high-resolution computer models. It captures large-scale circulation systems such as the Beaufort Gyre and the Transpolar Drift, while also resolving sharp fractures, swirling eddies, and the chaotic motion along the ice edge. This makes it a powerful tool for studying how a younger, thinner, and more mobile ice cover is changing, for estimating how much ice leaves the Arctic through narrow gateways, and for improving forecasts that guide polar shipping and engineering. In plain terms, the work gives scientists and decision-makers a far clearer movie of how Arctic sea ice is moving—and how that motion is evolving in a warming world.
Citation: Qiu, Y., Li, XM. Pan-Arctic sea ice drift data at 400 m grids based on spaceborne SAR. Sci Data 13, 377 (2026). https://doi.org/10.1038/s41597-026-06683-9
Keywords: Arctic sea ice, satellite radar, sea ice drift, computer vision, climate data