Clear Sky Science · en
Classifying land use within 80,000 mining sites on a global scale
Why mines matter in a warming world
The push to replace fossil fuels with clean energy is transforming our landscapes in unexpected ways. Solar panels, wind turbines, and electric cars all rely on metals dug from the ground, and the rush for these minerals is expanding mines across the globe. Yet until now, we have had only a blurry picture of how much land mining really occupies and what exactly is happening within those sprawling sites. This study delivers a sharp, global view of mining land use, helping society weigh the hidden environmental costs of the green energy transition.
Seeing mines from space
The authors built a worldwide map of land use inside more than 80,000 known mining areas across over 150 countries. Instead of just outlining where mines are, they break each mining site into different zones: deep open pits, piles of waste rock and tailings, disturbed ground, water bodies such as ponds and flooded pits, built facilities, bare soil, and remaining vegetation. In total, they find that mining activities that remove vegetation cover about 95,600 square kilometers of land—an area roughly the size of a medium‑sized country—equivalent to about 0.07% of the world’s land surface (excluding Antarctica). This fine-grained view reveals not only how widespread mining is, but also which parts of each site are most likely to pose risks to nature and people.
Combining color and height to read the land
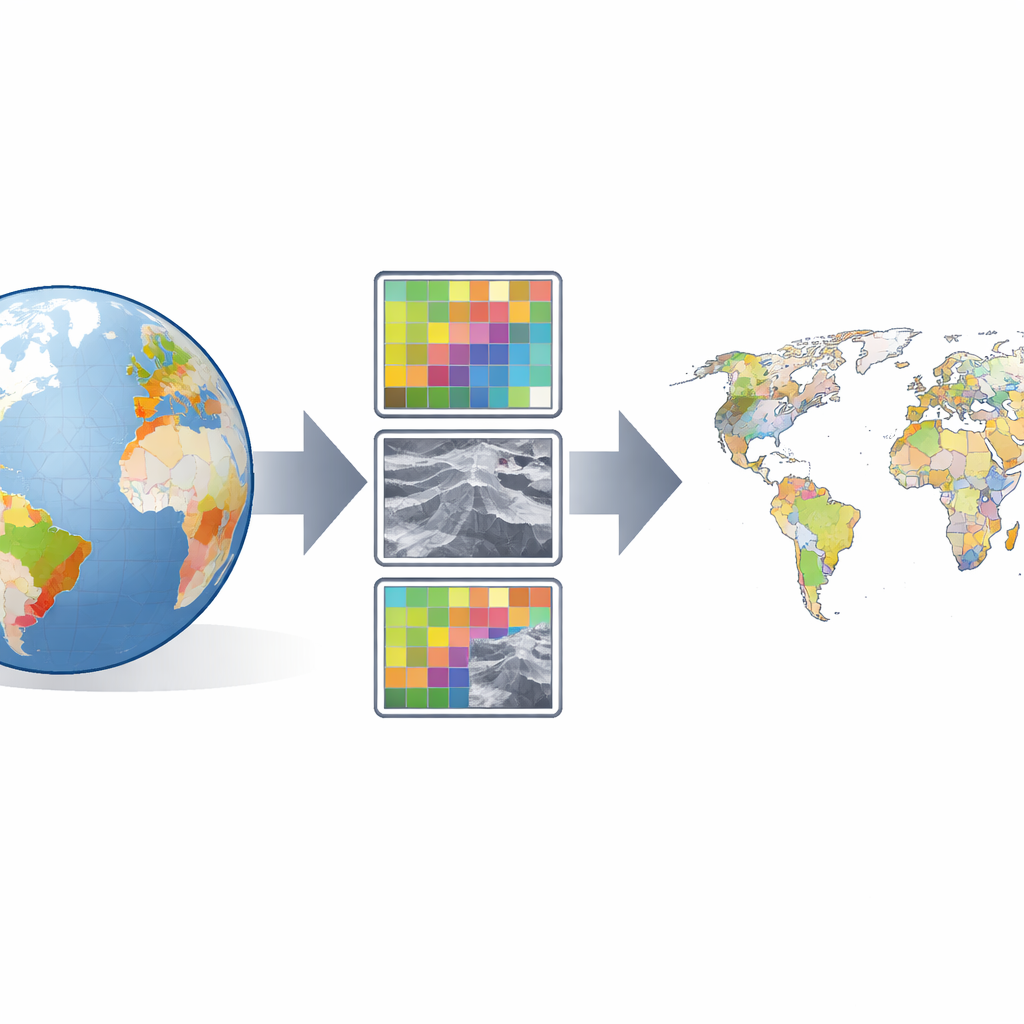
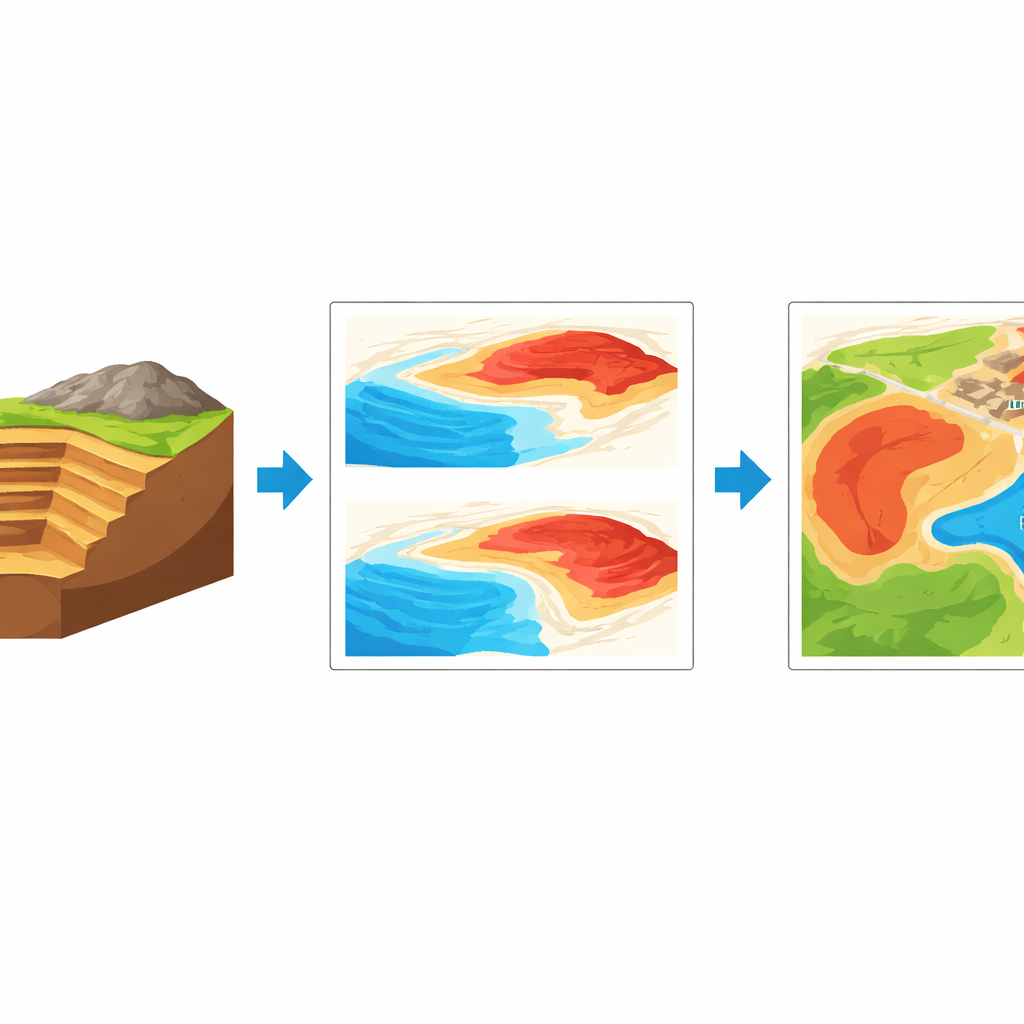
Distinguishing what is happening on the ground from satellite images is not straightforward. Open pits and waste dumps can look very similar in standard color images, because both expose bare rock and soil. To overcome this, the team combined two kinds of satellite data. First, they used optical images from Europe’s Sentinel‑2 mission, which provides detailed color information and allows calculation of indices that highlight vegetation, built surfaces, water, and bare soil. Second, they used elevation‑change maps from the TanDEM‑X radar mission, which measure how the height of the land surface has changed over time. Where the ground has been dug out for an open pit, the surface drops; where waste rock and tailings are piled up, the surface rises. By aligning these two datasets in time for each mine, the researchers could see both the “skin” and the “shape” of mining landscapes.
Teaching a computer to sort mining landscapes
Using hundreds of mining sites that were carefully labeled by experts, the authors trained a machine‑learning model known as a Random Forest classifier. They defined seven land‑use and land‑cover classes at the pixel level and refined training examples using thresholds on vegetation, water, bare soil, built surfaces, and elevation change to avoid ambiguous or mixed pixels. After training, the model was applied to all mining polygons worldwide and then smoothed so that neighboring pixels formed coherent patches. The result is a consistent, high‑resolution map of mining land use that can be downloaded region by region. When they tested how well the method worked, the combined color‑and‑height model correctly classified about 92% of validation pixels—substantially better than a model using color information alone.
What the global map reveals
The new dataset shows that within mining areas, bare soil and generally disturbed land occupy the largest share of space, followed by open pits. Eastern Asia stands out as having the largest total mining area and the greatest extent of open pits, with Latin America, North America, and Eastern Europe also hosting large footprints. When viewed on a coarse global grid, the map reveals clear hotspots: coal and metal belts in northern China, Indonesia’s mining regions, Australia’s resource‑rich interior, copper and gold belts in the Andes, and pockets of intensive activity in Africa and Central Asia. The data also shed light on small‑scale and artisanal mining in places like the Amazon, showing that earlier hand‑drawn boundaries often overstated the true area of active extraction by lumping large swaths of forest and unused land into “mining zones.”
Limits and uses of the new view
Because the mapping relies on 10‑meter satellite pixels, it cannot fully capture narrow features such as small buildings, roads, and some processing structures, which may be blended into categories like bare soil or disturbed land. Certain facility types, tailings dams, and leaching pads are grouped into broader waste or water classes. In addition, different mining sites are mapped for different years between 2017 and 2022, depending on when suitable elevation data were available, so the dataset is not a single snapshot in time. Despite these caveats, the authors argue that the dataset is well suited for global and regional studies of mining’s environmental footprint, such as tracking deforestation, assessing threats to biodiversity, or linking mineral supply chains to specific land impacts.
Why this matters for people and the planet
By moving from rough outlines of mines to detailed maps of what is happening inside them, this work offers a more honest account of the land cost of our mineral hunger. Not all ground within a mine is equally dangerous: deep pits, waste piles, and contaminated ponds pose far higher risks than untouched vegetation or lightly disturbed soil. By separating these zones at a global scale, the dataset allows governments, companies, and communities to focus attention on the most harmful parts of mining operations, design smarter regulations, and better balance the benefits of clean energy with the responsibility to protect ecosystems and local livelihoods.
Citation: Cheng, YT., Hoang, N.T., Maupu, L. et al. Classifying land use within 80,000 mining sites on a global scale. Sci Data 13, 338 (2026). https://doi.org/10.1038/s41597-026-06681-x
Keywords: mining footprint, remote sensing, land use, critical minerals, environmental impact