Clear Sky Science · en
Terrestrial and Airborne Laser Scanning Dataset of Trees in the Shivalik Range, India with Field Measurements and Leaf–Wood Classifications
Why Mapping Forests Tree by Tree Matters
Forests quietly help regulate the planet’s climate, store carbon, and support countless species, including people who depend on wood, food, and medicine. Yet we still struggle to measure how much living material – and therefore carbon – they hold, especially in complex tropical forests. This article introduces a new, openly available dataset from northern India that captures individual trees in three dimensions using laser pulses from the ground and from the air. It is designed to help scientists build better tools for tracking forest health, growth, and carbon storage at scales from single trees to satellite missions.
Seeing the Forest and the Trees
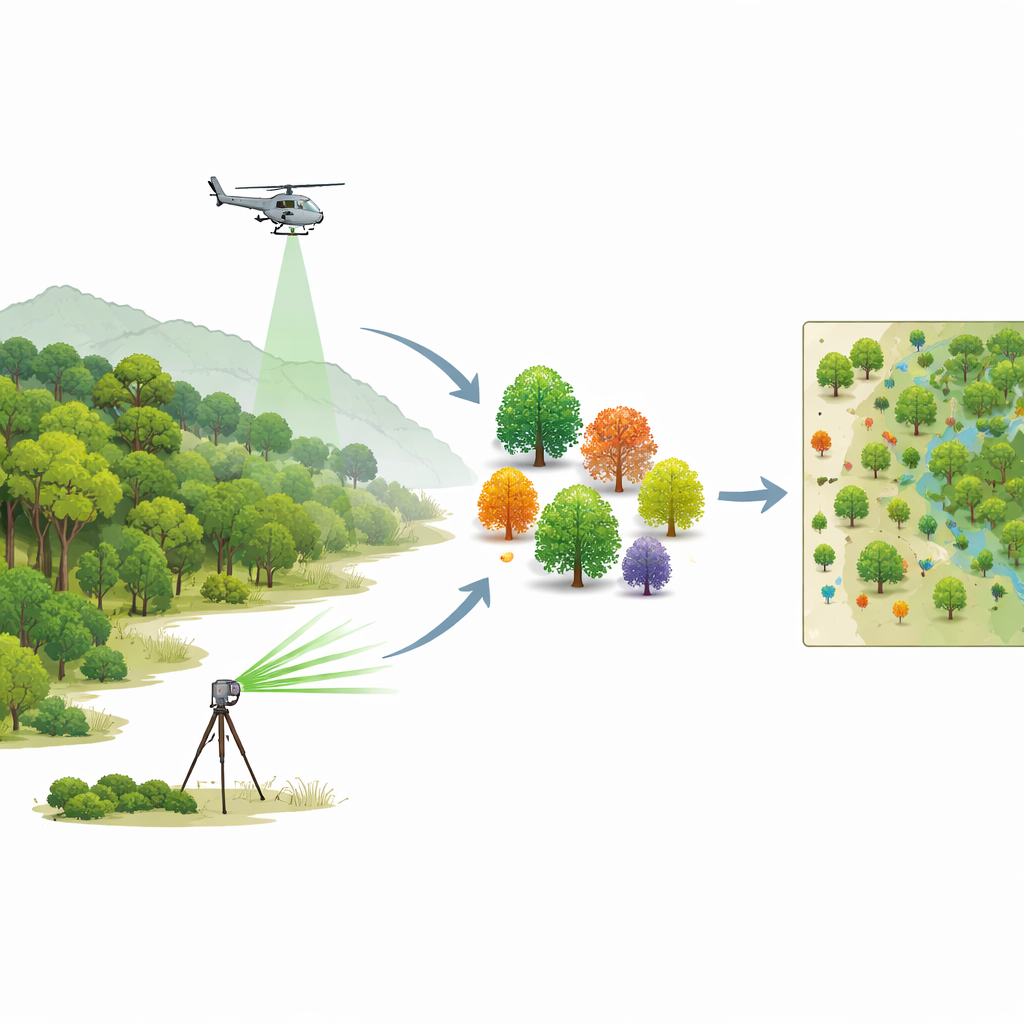
Instead of relying only on tape measures and field notebooks, the researchers used laser scanning to “paint” the forest with millions of distance measurements. Terrestrial Laser Scanning (TLS) instruments, set up on tripods inside the forest, recorded the fine details of trunks and branches. Airborne Laser Scanning (ALS), mounted on a helicopter, swept over the landscape to capture the broader canopy and terrain. Together, these views provide both close-up detail and wide-area coverage, letting scientists study 674 individual trees from 12 plots across the Shivalik Range in Haryana, India, representing 24 species in tropical and subtropical forests.
Building a Precise 3D Picture
To turn raw laser shots into reliable 3D trees, the team followed a careful chain of steps. Multiple ground scans were taken around each plot so that no side of a tree was missed. Because thick canopy blocks satellite signals, the team placed high-precision GPS receivers in nearby clearings and used a total station (a surveying instrument) to transfer those positions into the forest. Mathematical transformations then tied everything into a global coordinate system with centimetre-level accuracy. For the airborne data, the helicopter-mounted scanner and camera covered about 250 square kilometres, supported by marked ground targets and a reference GPS station, so the height and shape of the landscape could be mapped consistently.
From Raw Points to Individual Trees
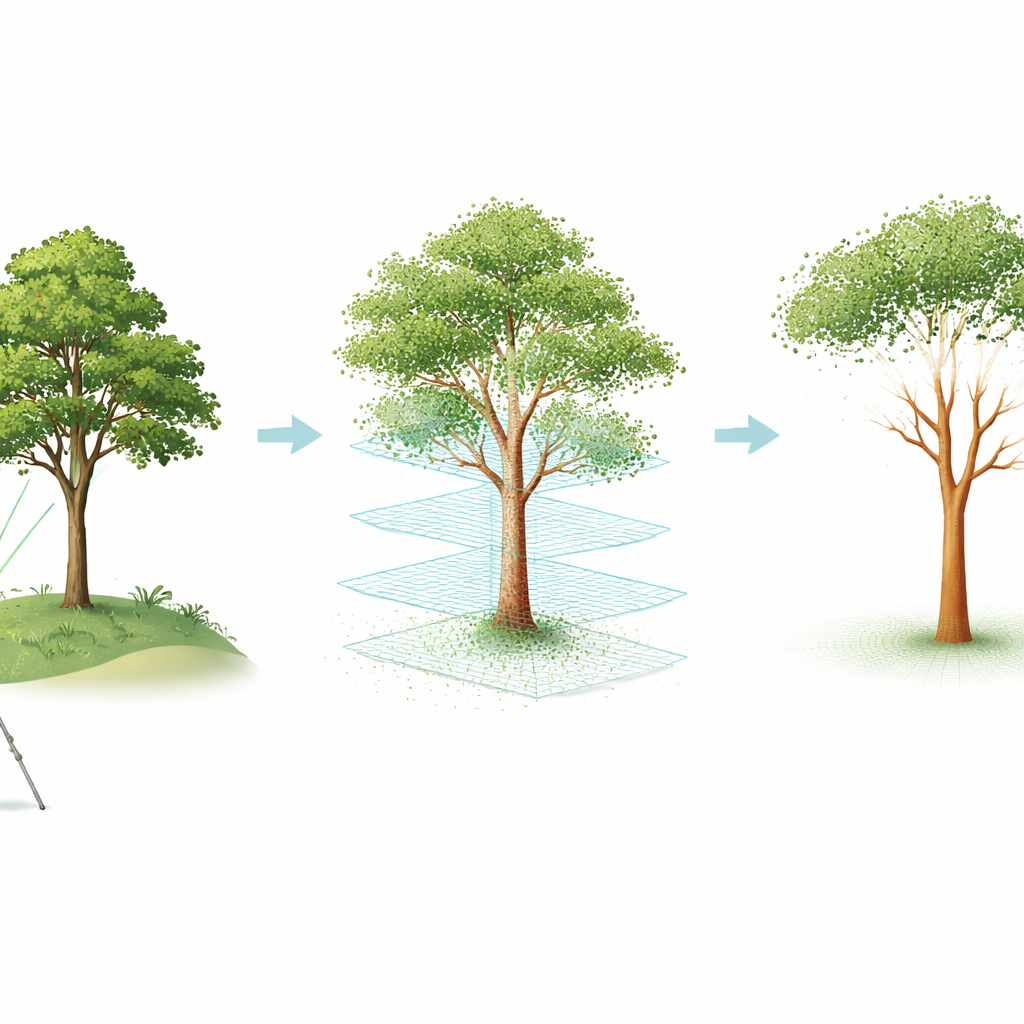
Each laser scan produces a “point cloud,” a swarm of dots showing where laser pulses hit leaves, bark, or ground. The researchers first cleaned these clouds by removing noise and identifying ground points to create a height reference. They then separated individual trees using software that automatically grouped points belonging to the same stem and crown, followed by human checks and corrections in tricky places where canopies overlap or understory vegetation is dense. The same 674 trees were then isolated in the airborne data so that every tree has both a detailed ground-based view and a broader aerial counterpart. Alongside the scans, field teams measured trunk diameter, identified species, and photographed bark and leaves, linking each digital tree back to a real, tagged tree in the forest.
Checking Leaf and Wood Structure
A special strength of this dataset is that many trees have their points labelled as either wood or leaves. Using interactive tools, experts manually separated trunk-and-branch points from foliage for trees with larger trunks. These hand-labelled trees serve as a reference to test automatic leaf–wood separation methods. The team ran four widely used algorithms on the data and compared their performance. While results were slightly less accurate than in simpler forests elsewhere, the ranking of methods matched previous studies, suggesting the new data are both realistic and of high quality. With wood-only versions of trees, researchers can more reliably estimate trunk and branch volume and therefore aboveground biomass.
From Plots to Satellites
To see how well the laser-derived measurements reflected reality, the authors compared tree heights and trunk diameters from TLS and ALS with field measurements. They found strong agreement, with small average differences that reflect both natural growth and differing viewpoints. Using advanced modelling tools, they estimated the volume of each tree and summarized how much wood different species contribute. For example, one pine species made up a small share of tree numbers but a large share of total volume, hinting at its outsized role in storing carbon. Because the dataset is openly shared through public repositories, it can now support many kinds of studies, from testing new machine-learning methods for species recognition to improving satellite missions like NASA-ISRO’s NISAR and ESA’s BIOMASS, which aim to monitor forests worldwide.
What This Means for the Future
In plain terms, this work provides a detailed “training gym” for the digital tools we need to understand and protect forests. By carefully mapping hundreds of individual trees in a previously underrepresented region, the authors give scientists a way to sharpen models that turn laser data into trustworthy information about tree size, shape, and biomass. As these models improve, so will our ability to track how much carbon is stored in forests, how they are changing over time, and how conservation and restoration efforts are working. For anyone concerned about climate change and biodiversity, this dataset is an important step toward seeing forests more clearly, from the leaves all the way up to orbiting satellites.
Citation: Ali, M., Biswas, A., Iglseder, A. et al. Terrestrial and Airborne Laser Scanning Dataset of Trees in the Shivalik Range, India with Field Measurements and Leaf–Wood Classifications. Sci Data 13, 420 (2026). https://doi.org/10.1038/s41597-026-06674-w
Keywords: forest lidar, tree biomass, tropical forests, remote sensing, carbon mapping