Clear Sky Science · en
Community-level education percentile rank estimation in China using multi-source big data and machine learning
Why your neighborhood’s education level matters
Where we live shapes the schools our children attend, the safety of our streets, and even the value of our homes. Yet in China, basic information about how educated different neighborhoods are has long been hard to get. This study changes that by using satellite images, street photos, and advanced computer algorithms to estimate the relative education level of more than 120,000 communities across the country, offering a new lens on social inequality and urban life.
Looking beyond years of schooling
Most statistics compare education by counting how many years people spent in school. But this can be misleading across generations. A high school diploma once put someone near the top of their age group; today, many of their children have university degrees. The authors instead use an “education percentile rank,” which tells you where a person stands within their own birth cohort, from 0 (least educated) to 100 (most educated). This way, an older person with only middle school—and a younger person with a bachelor’s degree—can be recognized as holding similar social standing if they both sit, say, around the 70th percentile of their generation.
Turning city landscapes into social clues
To map education percentile ranks at the community level, the team drew on six waves of a large national survey plus a wide array of “big data” that describe the built environment. They looked at what kinds of places surround each neighborhood—shops, schools, hospitals, parks, and offices—how dense the buildings and roads are, how bright the area appears at night from satellites, and how many people are typically present. From millions of street view photos, they used computer vision to measure green space, sidewalks, traffic, signs of disorder like litter or graffiti, and even how wealthy or safe a street looks to human observers. They also factored in terrain, such as elevation and slope, since steep or remote areas often lag in development. 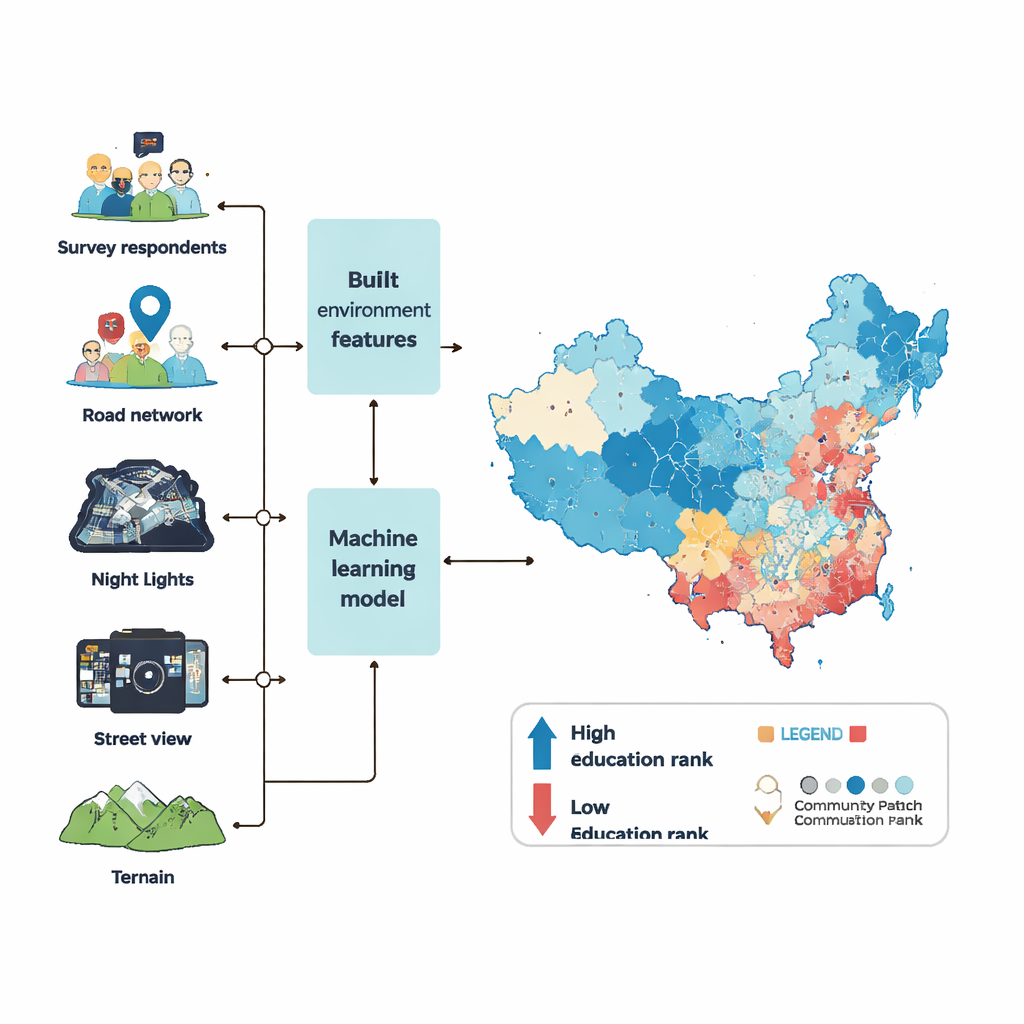
Teaching machines to read the city
With these ingredients, the researchers trained a powerful machine learning model (called XGBoost) to learn the link between a community’s physical features and the average education percentile rank of its residents. They first filled in gaps in the environmental data using a careful statistical “imputation” process so that missing values would not skew the results. Then they tuned the model’s internal settings through hundreds of optimization runs, judging performance by how well the model could predict education ranks for survey communities it had not seen before. The final model could explain more than 90 percent of the differences between communities in the test data, with only small errors—stronger performance than similar efforts in other countries.
What the new national map reveals
Armed with the trained model, the authors predicted mean education percentile ranks for 122,126 communities across mainland China in 2020, covering most urban land and about 85 percent of the population. City centers generally emerge as the most highly educated, followed by secondary hubs and then distant suburbs, though each metropolis has its own pattern. Beijing’s historic core, for example, does not host the very highest ranks, while Shenzhen’s highly educated zones are spread across multiple centers. To check reliability, the team compared their estimates with official census data and with proprietary location-based service records where available. At the prefecture and county levels, areas with higher predicted percentile ranks also show more years of schooling in the census. At the neighborhood level in Beijing and Guangzhou, their map aligns closely with both corporate and census benchmarks. 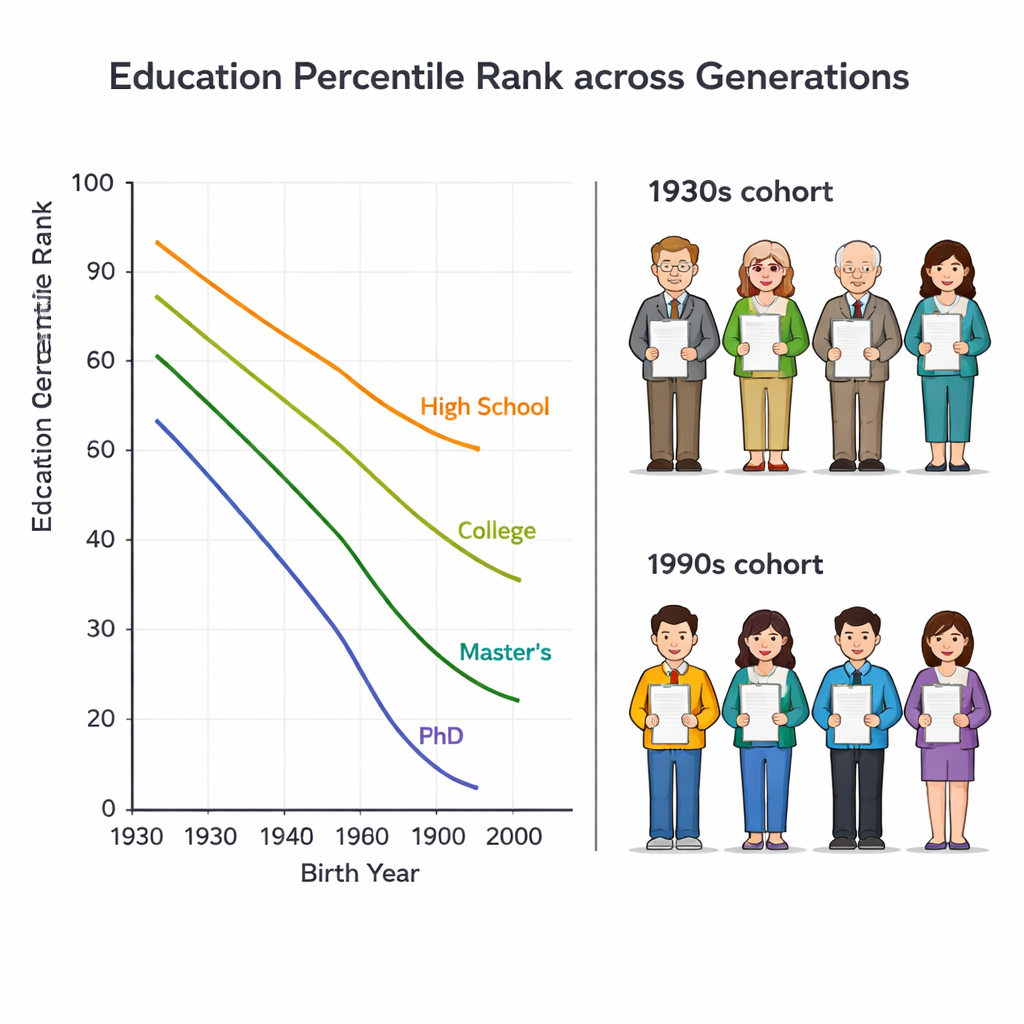
Why this matters for everyday life
For policymakers, planners, and researchers, this new open dataset offers a detailed, up-to-date portrait of educational advantage and disadvantage across Chinese cities. It can be used to study where middle-class enclaves are forming, how far gentrification has spread, or which districts may need better schools, social services, or public transport. For lay readers, the core message is simple: by “reading” the streets, lights, and buildings of a neighborhood, modern data tools can approximate its residents’ social position with surprising accuracy. This work does not replace traditional censuses, but it provides a fast, low-cost way to fill in the gaps between them and to better understand how the places we build reflect, and reinforce, our social divides.
Citation: Zhang, Y., Pan, Z., You, Y. et al. Community-level education percentile rank estimation in China using multi-source big data and machine learning. Sci Data 13, 304 (2026). https://doi.org/10.1038/s41597-026-06664-y
Keywords: education inequality, urban China, big data, machine learning, neighborhoods