Clear Sky Science · en
SYSU_Topo: a 1-arc-minute global bathymetry from SWOT-derived gravity using the gravity-geological method
Why Mapping the Hidden Seafloor Matters
Most of Earth’s surface lies underwater, yet the shapes of the ocean floor remain surprisingly blurry on our maps. Detailed seafloor maps are vital for understanding ocean currents, climate, marine life, and even where earthquakes and tsunamis may strike. This article presents a new global map of the seafloor, called SYSU_Topo, which uses a cutting-edge satellite mission to read subtle changes in Earth’s gravity field and turn them into a much sharper picture of the deep ocean bottom.
Seeing the Ocean Floor From Space
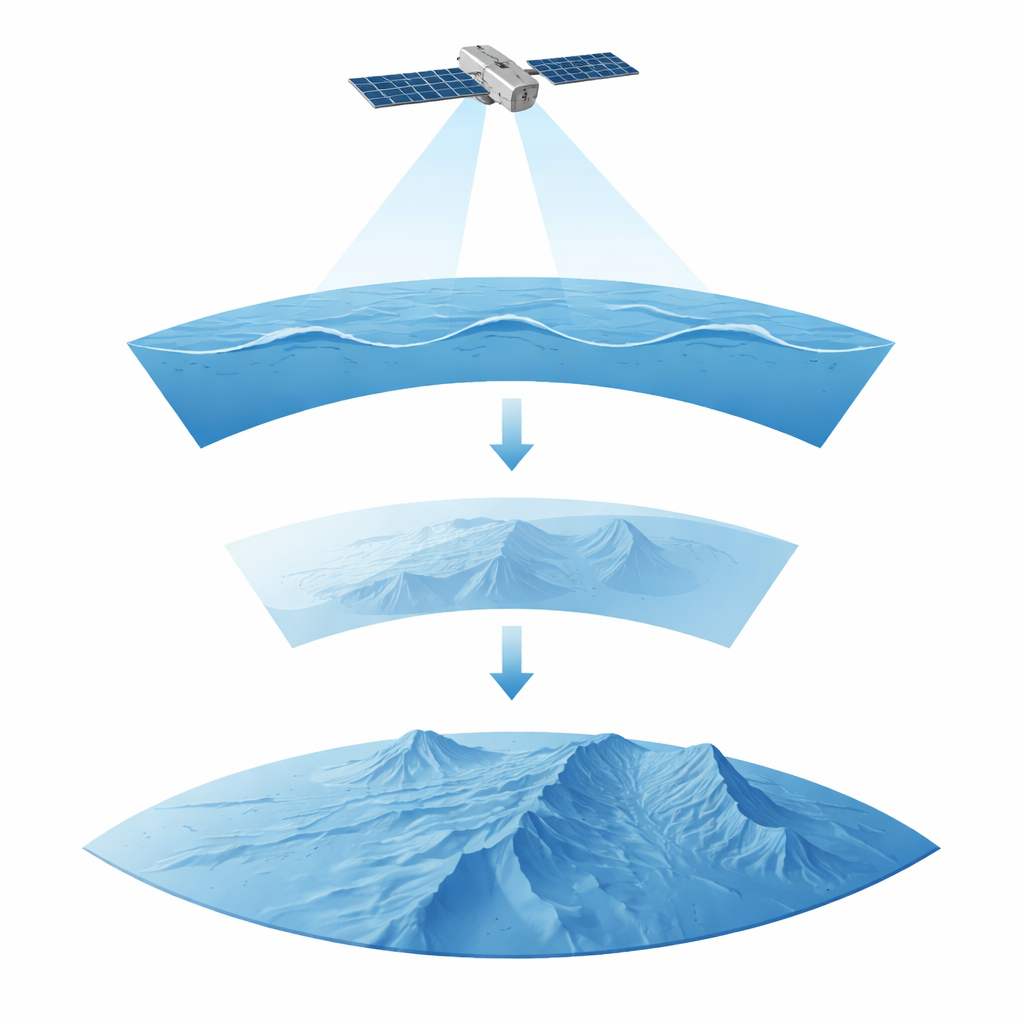
Traditionally, ships have traced out seafloor depths using sonar, sending sound pulses down and timing their echoes. These measurements are highly accurate but slow and expensive, leaving vast areas of the deep ocean barely sampled. Satellites offer another route: they cannot see the seafloor directly, but they can measure how underwater mountains and trenches subtly tug on the ocean’s surface through gravity. The new Surface Water and Ocean Topography (SWOT) satellite is especially powerful because it scans wide swaths of the ocean with high precision. Its measurements of sea surface height can be converted into a very detailed map of variations in gravity, which in turn can reveal hidden underwater features that ships have never crossed.
Turning Gravity Into a Seafloor Map
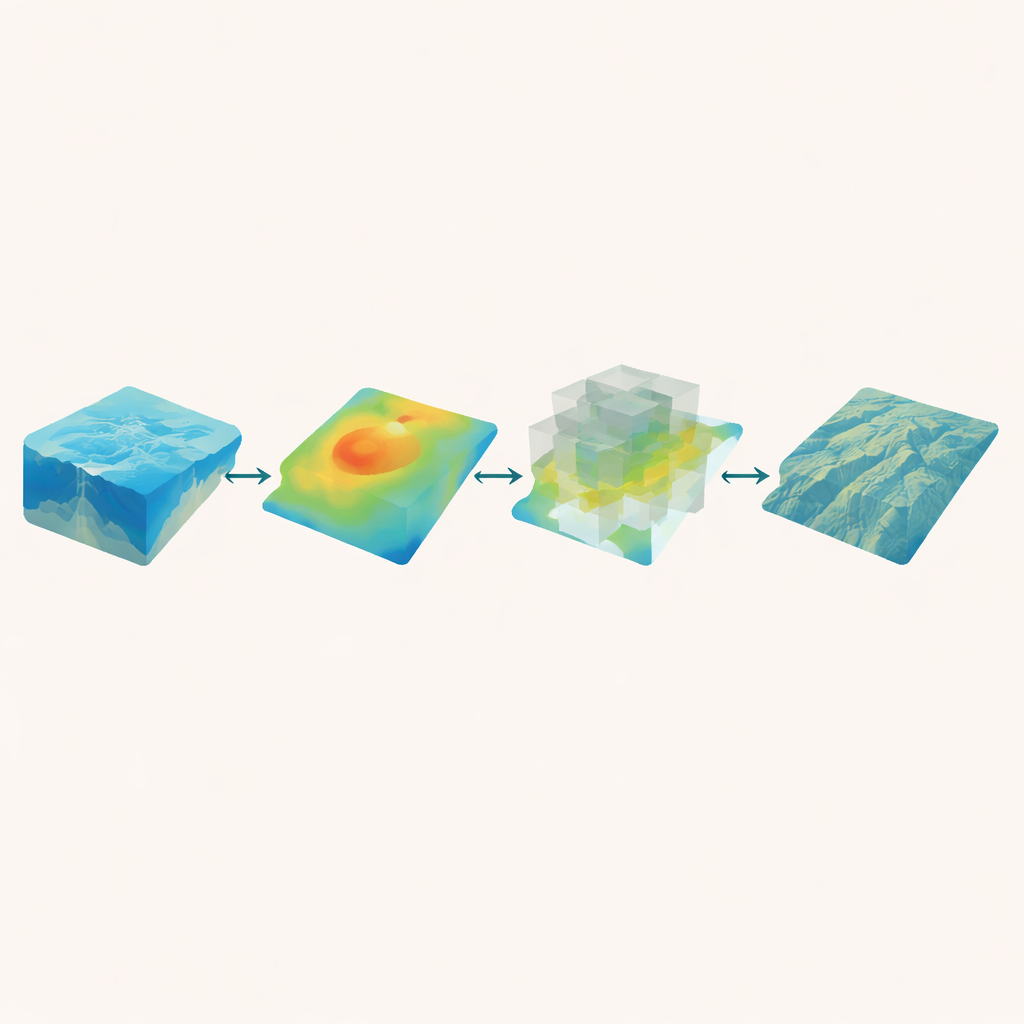
To turn this gravity information into depth, the authors use a method known as the gravity–geological method. At its core, this approach links how strongly the seafloor’s hills and valleys pull on the ocean above to how tall or deep those features are. The team combines SWOT-derived gravity data with millions of depth readings collected by ships to calibrate this relationship around the globe. They divide the oceans into many overlapping blocks and, for each one, search for the best “density contrast” between seawater and rock that makes the predicted depths match the ship data as closely as possible. By sliding these blocks across the globe and smartly blending their overlaps, they avoid sharp seams where neighboring calculations meet.
Smoothing the Gaps and Edges
Because ship tracks are unevenly distributed—dense along shipping lanes and sparse in remote and polar seas—the researchers design a flexible strategy. In data-rich regions, they work with smaller blocks to capture detail. In poorly measured areas, especially near the poles, they use larger blocks and, where necessary, carefully fill remaining holes with an existing reference model called GEBCO. They also introduce extra “helper” depth points along block edges, drawn from GEBCO where no ship soundings exist, to keep the stitched map from stepping up or down at boundaries. Near coasts, where gravity readings are less precise and the method can invent shallow “ghost” islands, they mask out the shallowest band and replace it with the trusted coastal depths from GEBCO, ensuring a realistic shoreline.
How Well the New Map Performs
To test the quality of SYSU_Topo, the authors withhold about ten percent of the ship measurements and compare their predictions against these unseen data points worldwide. On average, the new map matches these checks better than two leading global models that rely on older satellite data or machine learning. In particular, it cuts typical depth errors by tens of meters and captures the broad shape of mid-ocean ridges, seamount chains, and trenches more cleanly. In the South China Sea, where previous global models had little high-quality depth information to draw on, SYSU_Topo outperforms all competitors when compared against fresh, dense multibeam sonar surveys, highlighting how much SWOT’s sharper gravity view improves mapping in poorly explored basins.
What This Means for the Future Ocean Map
SYSU_Topo is released as an open dataset, along with companion files that describe its uncertainties and how strongly the depths depend on the assumed rock–water contrast. While the method still struggles with very fine features and complex coasts, it provides a new global benchmark that can be regularly updated as SWOT continues to fly and more ship and multibeam data are collected. For non-specialists, the key message is that we are learning to “feel” the shape of the seafloor from space with ever greater clarity. This new map does not replace detailed nautical charts, but it brings us closer to a complete, scientifically useful picture of Earth’s last largely unmapped frontier beneath the waves.
Citation: Feng, W., An, D., Hwang, C. et al. SYSU_Topo: a 1-arc-minute global bathymetry from SWOT-derived gravity using the gravity-geological method. Sci Data 13, 386 (2026). https://doi.org/10.1038/s41597-026-06641-5
Keywords: seafloor mapping, satellite gravity, SWOT mission, global bathymetry, ocean topography