Clear Sky Science · en
A Global High-Resolution Precipitation Climate Record: PERSIANN-CCS-CDR Version 2.0
Why tracking global rain really matters
From flash floods that shut down highways to crop-killing droughts, much of what shapes our daily lives falls from the sky as rain or snow. To understand how these events are changing in a warming world, scientists need detailed, decades-long records of when, where, and how hard it rains across the globe. This paper presents a new and improved global rainfall record, built from weather satellites, designed to zoom in on the kinds of short, intense downpours that often cause the most damage.
Building a sharper picture of rainfall from space
Rain gauges and radar give excellent local measurements, but they cover only a fraction of the planet and are expensive to build and maintain, especially in poorer regions. Satellites, circling high above Earth, are the only tools that can watch rain systems almost everywhere at once. The new dataset, called PERSIANN‑CCS‑CDR Version 2.0, combines long-running satellite images of cloud tops with a computer-learning system that has been refined over decades. It delivers estimates of rainfall on a grid roughly 4 km across, every three hours, from 60° north to 60° south latitude—fine enough to capture many extreme storms that older, coarser products tend to blur out. 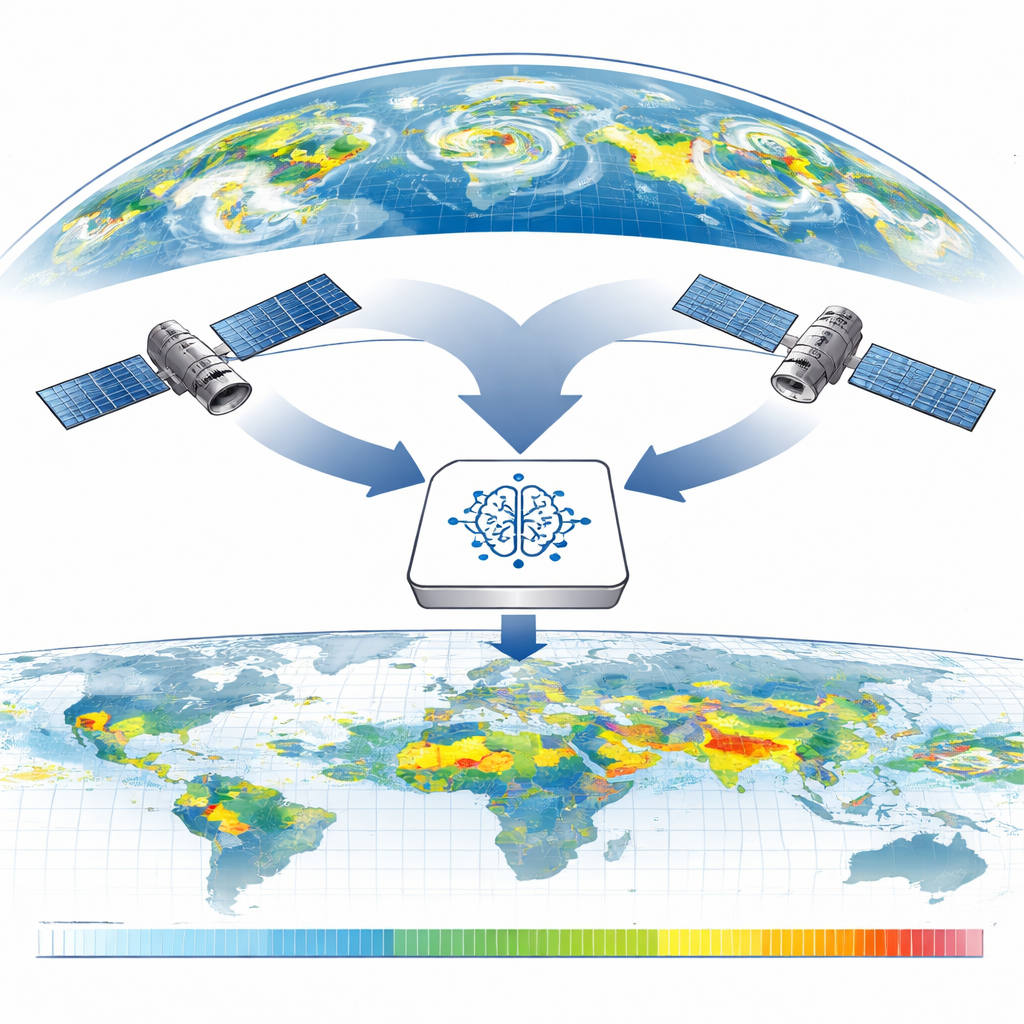
A tale of two satellite data streams
An earlier version of this dataset tried to stitch together two different satellite image collections into one seamless record: an older product (GridSat‑B1) reaching back to 1983 and a newer, sharper one (CPC‑4km) available since 2000. That attempt ran into trouble. Hidden technical differences between the inputs led to abrupt jumps in the statistics of heavy rain right around the year 2000, and a few corrupt files caused spurious spikes in global averages. After extensive investigation, the authors concluded that forcing the two inputs into a single continuous product was unrealistic. Version 2.0 instead offers two closely related sub-datasets, each internally consistent but based on one input source only: a longer record built on GridSat‑B1 and a shorter, higher-performing record built on CPC‑4km.
Putting the new record to the test
To check how trustworthy these products are, the team compared them against one of the best regional datasets available for the United States: the STAGE IV analysis, which blends radar and rain gauges. They looked in detail at the upper Mississippi River basin and also at river basins in the West Amazon and along the Mekong to see how well the satellite products capture patterns of heavy rain, light rain, and dry spells over many years. Beyond long-term averages, they tested the data against real-world extreme events, including Hurricane Michael in 2018 and a destructive 2024 storm outbreak over the U.S. Upper Midwest. By examining how often the products detected rain, how large the affected areas were, and how strong the peaks appeared, they could judge how well each version performs in the situations people care about most.
What the comparisons reveal about extremes
The CPC-based product (PERSIANN‑CCS‑CDR‑CPC) consistently matches the high-quality STAGE IV data more closely than the GridSat-based version (PERSIANN‑CCS‑CDR‑B1), especially for intense downpours and very wet days. It does, however, share common satellite limitations: it tends to miss very light rain and struggles with the most extreme short bursts of rainfall. The B1-based product sometimes shows unrealistically concentrated rainfall in a few pixels, a side effect of how its images are processed and their lower sampling frequency. When the data are averaged to a coarser grid, an older companion product (PERSIANN‑CDR) still performs very well overall, but its low resolution smooths out the sharp peaks that define many extreme events. 
How to use this tool—and why it matters
The authors emphasize that PERSIANN‑CCS‑CDR Version 2.0 is meant for questions where high detail in space and time is crucial: tracking the structure of hurricanes, mapping rainfall during severe storms, or studying how extremes are changing over decades. For broad, lower-resolution climate analyses, they recommend sticking with established products like PERSIANN‑CDR or related datasets. For users focused on the period since 2000, the CPC-based version is the preferred choice; the B1-based version is most useful when researchers need to extend analyses back to the early 1980s and can tolerate somewhat lower performance. Together, these datasets offer a clearer, more reliable view of global rainfall extremes—an essential ingredient for preparing communities, managing water resources, and understanding how our climate’s most dramatic storms are evolving.
Citation: Bolboli Zadeh, M., Nguyen, P., Hsu, KL. et al. A Global High-Resolution Precipitation Climate Record: PERSIANN-CCS-CDR Version 2.0. Sci Data 13, 314 (2026). https://doi.org/10.1038/s41597-026-06625-5
Keywords: satellite rainfall, extreme precipitation, climate data record, hurricanes, global hydrology