Clear Sky Science · en
Enhanced 30 m Impervious Surfaces for China (2020, 2022) via 2 m/30 m Data Fusion
Paved Places You Can’t See from the Ground
Cities and roads are changing China’s landscape at a breathtaking pace, but from the ground it is hard to grasp just how much land has been covered by concrete, asphalt, and rooftops. This paper introduces a new, highly detailed map that shows where such "impervious" surfaces are located across almost all of mainland China in 2020 and 2022. Because these hard surfaces shape flooding, heat waves, pollution, and even where solar panels can go, having an accurate national picture matters to everyone from climate scientists to city planners and homeowners.
Why Hard Ground Matters
Impervious surfaces are places where rainwater cannot soak into the soil—think highways, parking lots, factory yards, and dense neighborhoods. As cities expand, these areas grow, speeding up storm runoff, raising flood risk, trapping heat, and squeezing out habitats for plants and animals. Many computer models that predict carbon storage, water cycles, and nutrient flows on land rely on maps of what covers the ground. If the maps underestimate or misplace built-up areas, those models can be seriously off. Existing global land-cover products often lump many human-made areas into a single broad category and tend to miss small villages, narrow roads, and mixed areas where buildings and open land are interwoven—features that are especially common in China.
Blending Sharp Vision with Big-Picture Views
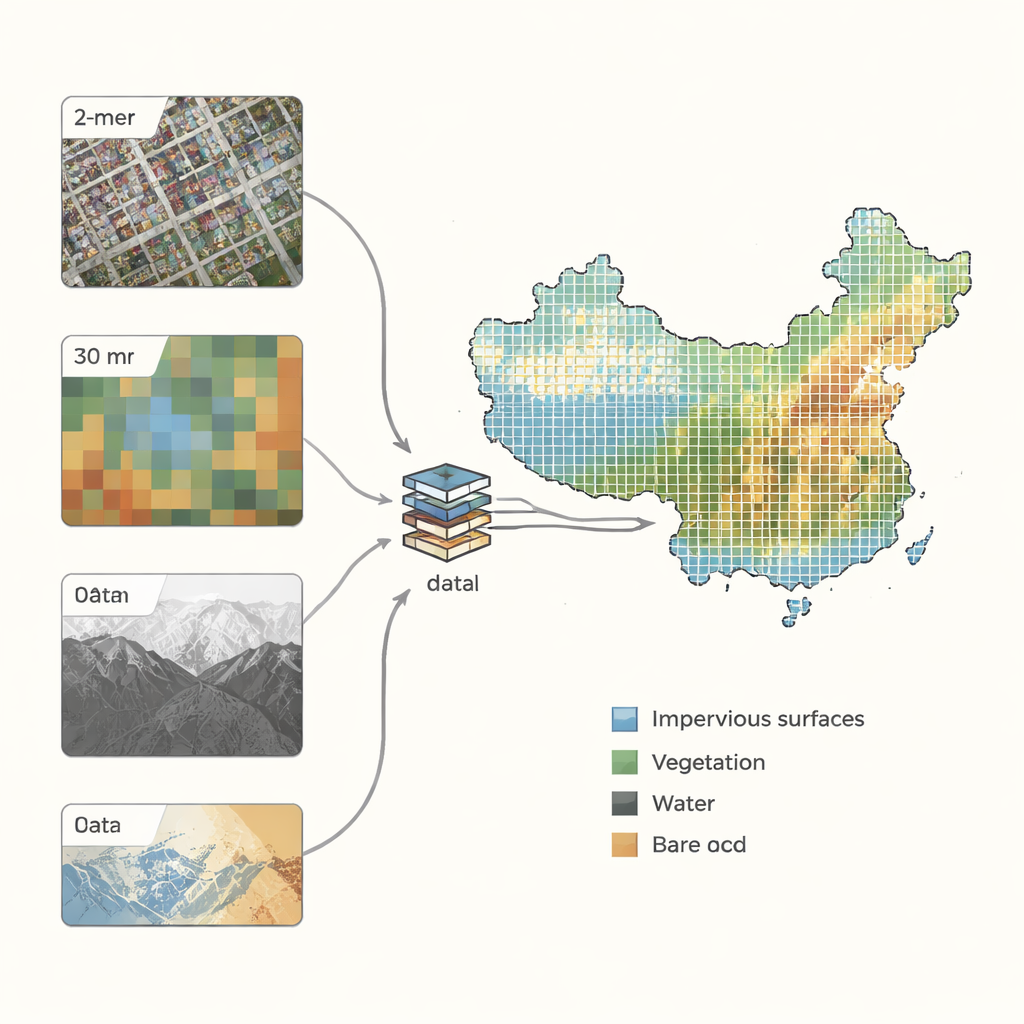
The authors tackled these gaps by fusing two kinds of satellite data. Sharp, 2-meter imagery from China’s Gaofen and Ziyuan satellites provides street-level-like detail, while 30-meter Landsat images and elevation data cover the entire country consistently. They first built cloud-free mosaics from the 2-meter scenes for 2020 and 2022, then paired them with annual composites of Landsat’s visible and infrared bands plus terrain information. To train their model, they designed a clever sampling strategy: using a concept from information theory called Shannon entropy, they picked areas with especially diverse mixtures of land types and urban development stages, ensuring that the examples fed to the algorithm reflected everything from desert towns to coastal megacities.
Teaching the Computer to Read the Landscape
From these carefully chosen spots, experts visually inspected high-resolution image chips and labeled 200,000 sample locations into four broad classes: impervious surfaces, vegetation, water, and bare land or other. Importantly, they did not discard “messy” mixed pixels where a 30-meter area contains, for example, both buildings and trees; instead, they kept them and adjusted their influence during training, since such mixed pixels are common in real cities. The team then built a dual-branch deep learning system. One branch, based on a 50-layer residual network, learned patterns directly from the image patches, while the other processed simple numerical data such as Landsat reflectance and terrain. The model combined both streams to decide which of the four classes each 30-meter pixel most likely belonged to.
Adapting to a Vast and Varied Country
China’s landscapes range from humid coastal plains to deserts and high plateaus, and human settlements look very different in each. To handle this, the researchers first grouped the country into five broad regions—plateaus, arid zones, plains, hills, and mountains—using climate, topography, cloud conditions, and existing land-cover statistics. They then trained several versions of the model, each weighted to perform best in one region plus a general-purpose national model. During mapping, they evaluated which version worked best inside each one-degree grid cell (about the size of a small province) using validation data, and locally chose that model. This regionally adaptive approach greatly improved performance, especially in challenging western areas where built surfaces can look spectrally similar to bare soil.
How Good Is the New Map?
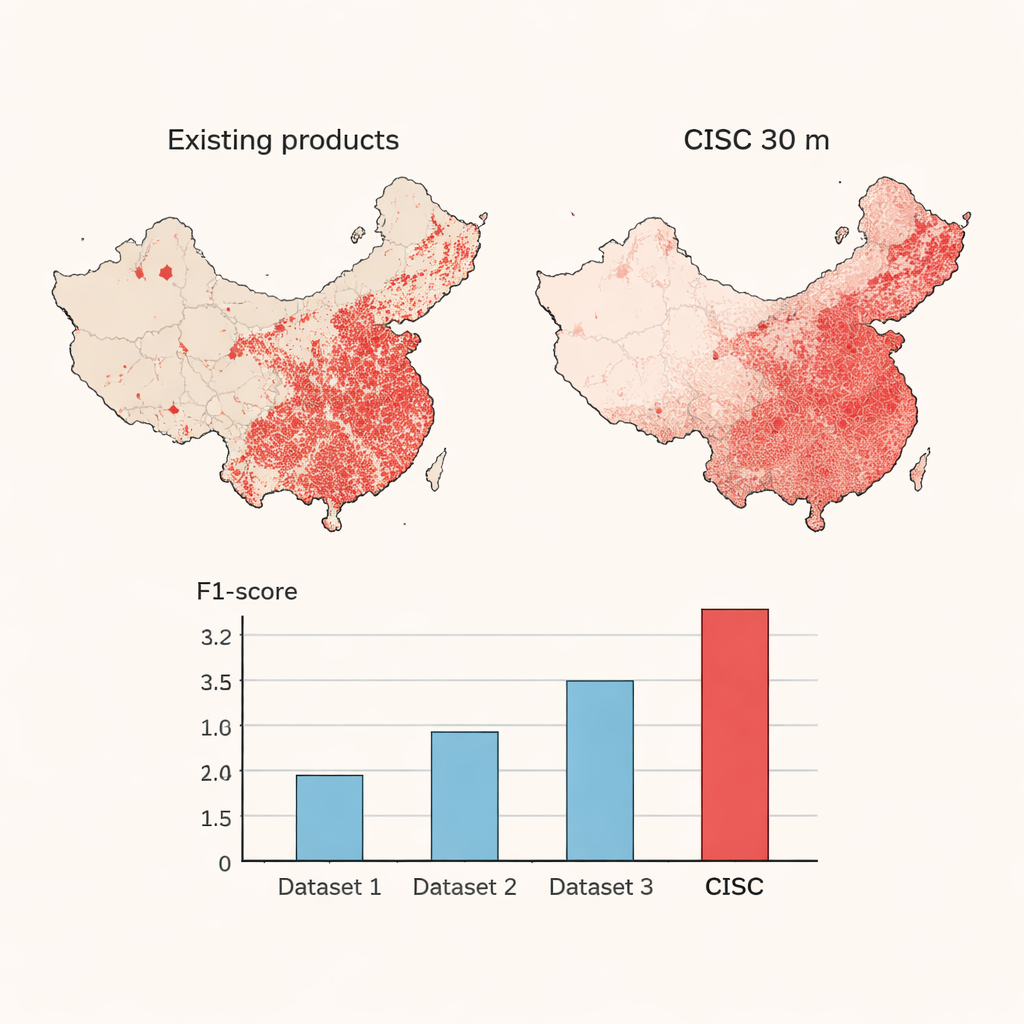
The resulting China Impervious Surface Cover products for 2020 and 2022 are provided as easy-to-use tiled files at a 30-meter resolution, with each pixel tagged as impervious, vegetation, water, or bare land. When tested against independent expert-labeled points, the 2020 map reached a very high F1-score—an overall accuracy measure—of about 0.94 for impervious surfaces, substantially outperforming three widely used global products. Visual comparisons across seven contrasting regions show that the new dataset picks up fine road networks, scattered rural villages, and low-density settlements that other products often miss, while still avoiding large false patches in deserts, high mountains, and wetlands. The authors note remaining issues, such as tiny data gaps along some satellite scene edges and the inherent difficulty of mixed pixels, but they outline plans to reduce these in future work.
What This Means for Everyday Life
For non-specialists, the take-home message is that we now have one of the most reliable, detailed pictures yet of where China’s land has been hardened by human construction, for two recent years. This map can feed into better flood risk assessments, more realistic urban climate and air-quality modeling, smarter placement of rooftop solar, and more informed planning of new infrastructure. In short, by teaching computers to read satellite images more intelligently and tailoring them to China’s diverse landscapes, the study offers a powerful tool to understand how quickly the country is trading soil and vegetation for concrete—and what that means for people and the environment.
Citation: Yin, R., He, G., Wang, G. et al. Enhanced 30 m Impervious Surfaces for China (2020, 2022) via 2 m/30 m Data Fusion. Sci Data 13, 297 (2026). https://doi.org/10.1038/s41597-026-06619-3
Keywords: urbanization, impervious surfaces, remote sensing, land cover mapping, China