Clear Sky Science · en
A large-scale, multitask, multisensory dataset for climate-aware crop monitoring in the US from 2018–2022
Why watching fields from space matters
Feeding a growing population in a warming world depends on knowing how crops are doing long before harvest. Heat waves, droughts, and shifting seasons can make yields swing wildly from year to year, with huge impacts on food prices and farmer livelihoods. Yet researchers and agronomists have lacked a single, comprehensive source of information that ties together satellite images, weather, soils, and on-the-ground harvest data at scale. This article introduces CropClimateX, a new open database designed to fill that gap for the United States, helping scientists build better tools to anticipate crop stress, improve farm management, and strengthen food security.
Bringing many lenses together
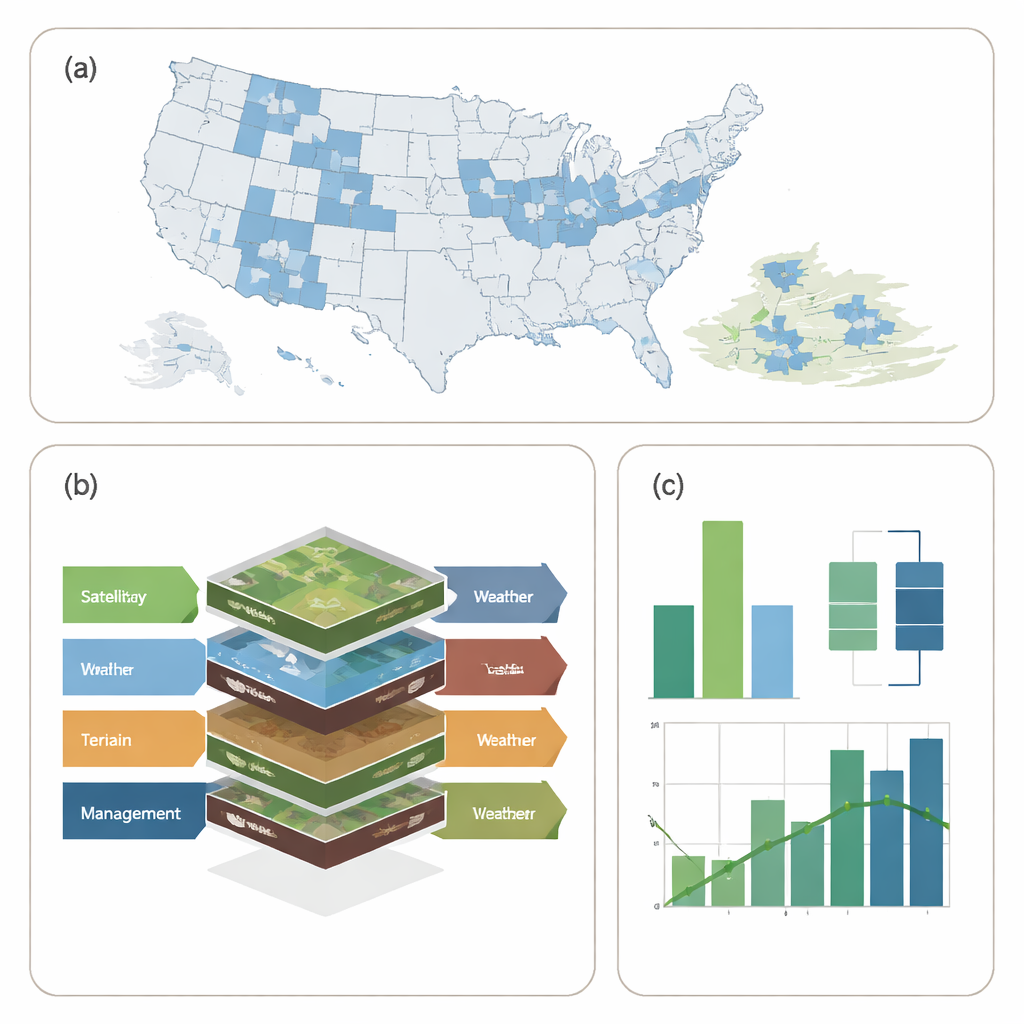
CropClimateX is built around a simple idea: no single measurement can tell the full story of how crops grow under changing weather. The authors therefore stitch together many “lenses” on the land. High-resolution optical satellites such as Sentinel-2 and Landsat-8 show how green and dense vegetation is across farm fields. Radar data from Sentinel-1 adds information on field structure and moisture, even through clouds. Coarser sensors like MODIS track broader patterns in plant growth, leaf area, and land surface temperature. On top of this, the database layers daily weather records, drought indicators, soil properties such as texture and organic carbon, terrain features like elevation and slope, and county-level statistics on how much of each crop was planted, harvested, and yielded each year.
Carving the country into smart tiles
A key challenge is that the United States is vast, and storing every pixel from every satellite for every day would be unmanageable. Instead of blanketing the whole country, the team divides cropland into many smaller, carefully chosen tiles they call “minicubes.” Each minicube covers a 12 by 12 kilometer area and contains a time series of all relevant satellite and weather data. Between 2018 and 2022, the authors created 15,500 such minicubes across 1,527 counties, focusing on the main food and fiber crops: corn, soybeans, winter wheat, cotton, and oats. This design keeps the data compact enough to handle on modern computers, yet detailed enough to capture differences between neighboring fields and management zones.
Using algorithms to focus on real farms
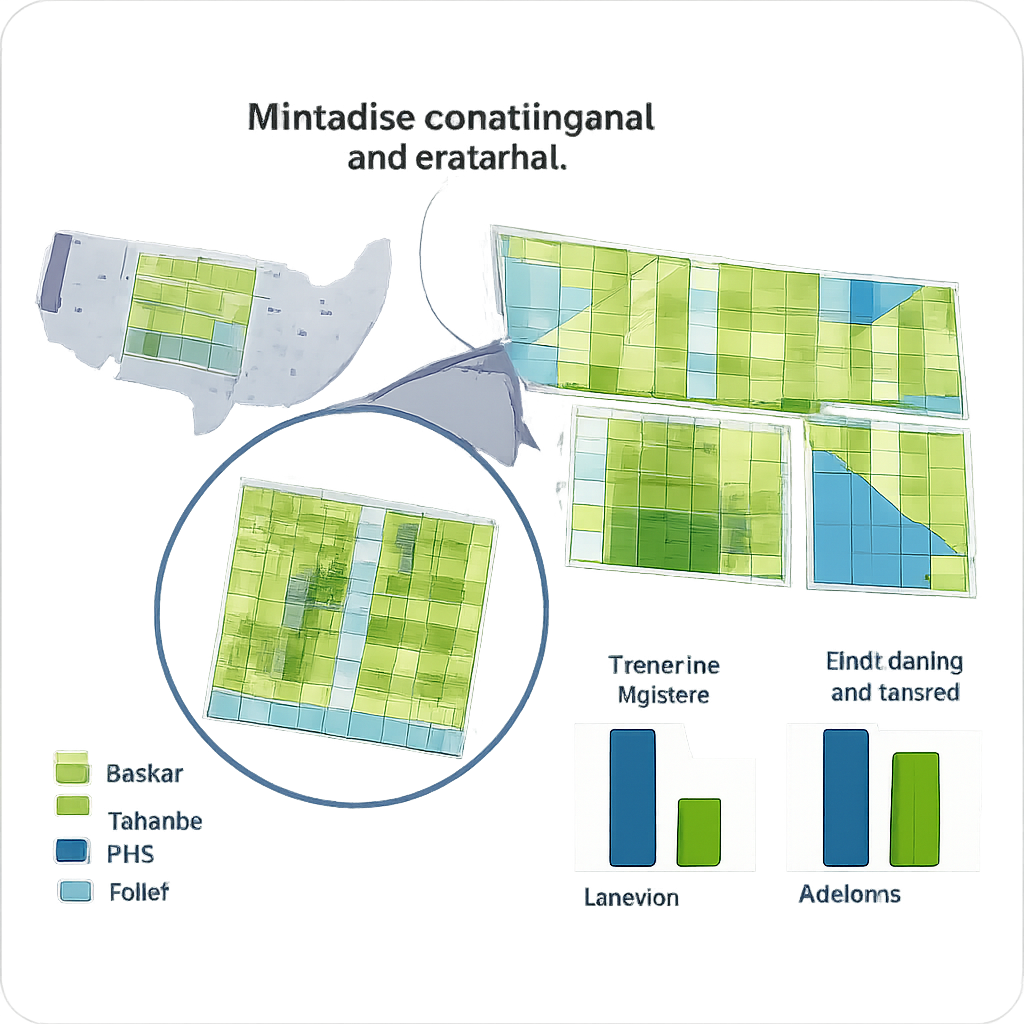
To decide where to place these minicubes, the researchers did not simply lay a rigid grid over each county. Many counties include cities, forests, or lakes that are irrelevant for crop monitoring. Instead, they designed two optimization strategies that search for tile positions that capture as much cropland as possible while avoiding wasted area. One approach, the Sliding Grid Algorithm, gently shifts a regular grid until it lines up well with the fields. The other, a Genetic Algorithm, mimics evolution by testing, mutating, and recombining candidate layouts. By combining the best solutions from both methods, the team reduced the number of tiles by 43% compared with a naive grid, yet still covered about 93% of the crop area—greatly shrinking storage needs without sacrificing useful information.
Capturing climate extremes on the farm
CropClimateX is not just a map of average conditions; it also tracks the extremes that matter most to farmers. The authors link each minicube to weekly drought categories from the U.S. Drought Monitor and to specially designed heat and cold wave indicators computed from daily temperature. Over 2018–2022, almost all minicubes experienced at least moderate drought at some point, and many saw severe or even exceptional drought conditions. The database also includes detailed soil and terrain layers, allowing researchers to ask, for example, whether sandy fields suffer earlier under drought than heavier soils, or how slope affects water stress. Together, these layers offer a rich picture of how climate shocks play out over America’s patchwork of fields.
What this means for future harvests
For non-specialists, the key outcome is that CropClimateX turns a jumble of satellite, weather, and farm statistics into a single, well-organized resource that anyone can use. Because the minicubes line up crop yields with what the land and sky looked like over the growing season, they provide ideal training data for modern machine learning models. These models can learn to predict yields, flag emerging crop stress, test which sensors are most informative, or explore how future climate extremes might ripple through food production. In practical terms, that means better early warnings, smarter management advice, and more robust planning for a hotter, more variable climate—all grounded in open data that covers real farms across the United States.
Citation: Höhl, A., Ofori-Ampofo, S., Fernández-Torres, MÁ. et al. A large-scale, multitask, multisensory dataset for climate-aware crop monitoring in the US from 2018–2022. Sci Data 13, 72 (2026). https://doi.org/10.1038/s41597-026-06611-x
Keywords: crop monitoring, remote sensing, climate extremes, machine learning, agricultural data