Clear Sky Science · en
Brain/MINDS Marmoset Brain Atlas 2.0: Population Cortical Parcellation With Multi-Modal Templates
Why a tiny monkey brain matters
The common marmoset is a small monkey, but its brain is surprisingly similar to ours in how it is organized and wired. Researchers increasingly use marmosets to study conditions like Alzheimer’s disease and age‑related brain decline, because experiments that are impossible in humans can be done safely in animals. This paper introduces a new, high‑precision 3D digital map of the marmoset brain, called Brain/MINDS Marmoset Brain Atlas 2.0 (BMA2.0). It provides a common reference system so that data from many laboratories, scanners, and experiments can be compared and combined—an essential step toward understanding how primate brains work and how they fail in disease.
From one brain to a population view
Earlier marmoset brain atlases were usually built from a single animal. That is like trying to understand the “typical” human face from one photograph: it ignores natural differences in size, shape, and fine details. BMA2.0 instead averages information from many individuals—91 ex vivo (post‑mortem) MRI scans, 446 living marmoset MRI scans, and detailed tissue stains from 10 brains. By carefully aligning all these brains into one coordinate system, the atlas captures the most common pattern of folds and regions while smoothing out idiosyncrasies. The result is a symmetric, population‑based template that better reflects what a typical marmoset brain looks like.
Layered views of the brain’s structure
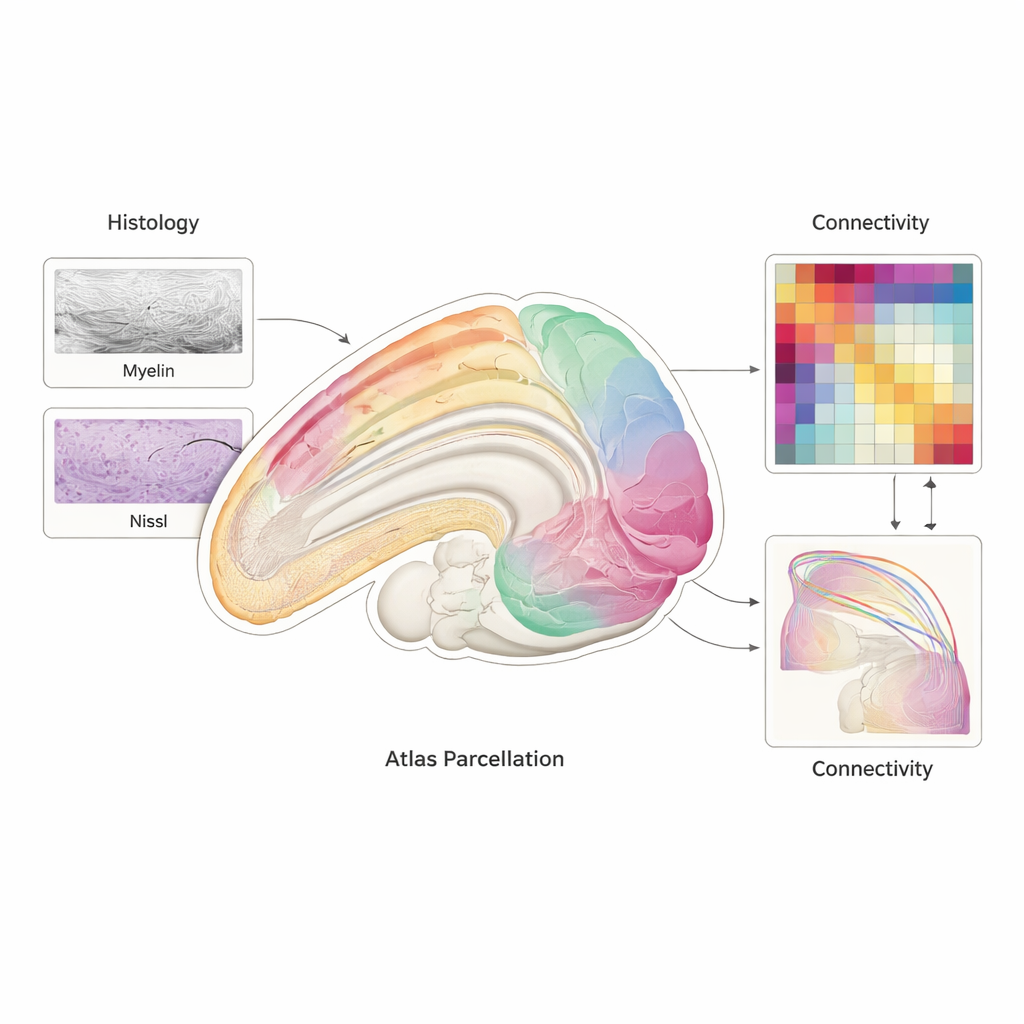
To divide the brain into meaningful parts, the team combined several types of images. High‑resolution myelin staining highlights the brain’s wiring, while Nissl staining shows the distribution of cell bodies. Ex vivo and in vivo MRI add whole‑brain coverage similar to what is used in human hospitals. Using these contrasts together, experts manually outlined 117 regions in the outer “gray matter” per hemisphere and refined 156 deep structures and 45 cerebellar regions. Advanced registration software and artificial‑intelligence models then stitched thousands of 2D tissue slices back into consistent 3D volumes, matched them to MRI, and averaged them across animals. The final atlas parcels each hemisphere into 323 regions and comes with flat maps and surface models that let scientists visualize the cortex as if it were unfolded onto a sheet.
Smart algorithms behind the scenes
Building such a detailed atlas is technically demanding. Tissue slices can warp, stain colors differ between methods, and images from different scanners do not line up on their own. To overcome this, the authors used modern image‑registration algorithms together with deep‑learning tools. One network learns to transform Nissl images into myelin‑like images so that two very different stains look more comparable. Another learns to mark the boundaries between the cortex, deeper structures, and background, providing extra “landmarks” that help the registration lock structures into place. To ensure that regions follow the natural column‑like direction of the cortex, a mathematical approach based on Laplace’s equation traces streamlines from the brain’s outer surface down to the white matter, assigning each small volume element to the most likely region along these paths.
Connecting anatomy with function
BMA2.0 is more than a static picture; it is designed to link structure and activity. The authors show that when they use the atlas regions to summarize resting‑state fMRI signals from awake marmosets, the patterns of activity over time are more consistent across sessions and animals than when the brain is cut into arbitrary, distance‑based chunks. They also construct a population‑average map of white‑matter connections using diffusion MRI from 126 animals, and compare it with a separate dataset of tracer injections that track real axons. The two independent maps agree well, supporting the idea that the atlas captures biologically meaningful wiring. Because BMA2.0 can be translated into the coordinate systems of several other marmoset atlases, it also acts as a hub to merge past and future datasets.
What this means for brain research
For non‑experts, the key message is that BMA2.0 gives scientists a much more reliable “geographical map” of the marmoset brain, based not on one animal but on a population and on multiple imaging methods. This makes it easier to compare results between studies, to relate fine‑grained anatomy to brain signals and behavior, and to probe how diseases and treatments reshape brain networks. Because marmosets are close relatives of humans and already widely used in aging and dementia research, this atlas should help translate findings from small monkeys to big questions about the human brain.
Citation: Gong, R., Ichinohe, N., Abe, H. et al. Brain/MINDS Marmoset Brain Atlas 2.0: Population Cortical Parcellation With Multi-Modal Templates. Sci Data 13, 274 (2026). https://doi.org/10.1038/s41597-026-06601-z
Keywords: marmoset brain atlas, population neuroimaging, multimodal MRI, cortical parcellation, primate connectome