Clear Sky Science · en
A CT Dataset with RECIST Measurements and Comprehensive Segmentation Masks for Tumors and Lymph Nodes
Why this cancer imaging resource matters
Cancer care increasingly depends on medical images to decide whether treatments are working. Yet the careful, slice‑by‑slice measurements doctors make on CT scans are time‑consuming and can differ from one expert to another. This article presents a new, openly available collection of CT scans from cancer patients, with tumors and lymph nodes painstakingly outlined and measured according to a widely used clinical rulebook. It is designed to help researchers build and test computer programs that could one day take over much of this tedious work and make cancer treatment monitoring faster and more consistent worldwide.
How doctors currently track tumors
To judge if a cancer treatment is helping, radiologists often follow a standard called RECIST 1.1. In practice, that means they choose a handful of “target” tumors on a patient’s CT scans and record the longest visible diameter of each one in millimeters. Over time, they compare the sum of these diameters to earlier scans to decide whether the disease has shrunk, stayed stable, or grown. While this approach has brought much-needed order to clinical trials, it also has drawbacks: it depends heavily on which tumors the doctor picks, relies on one‑dimensional measurements rather than true 3‑D size, and typically takes more than 10 minutes per patient per assessment. As cancer cases rise worldwide, these limits put real pressure on radiology services.
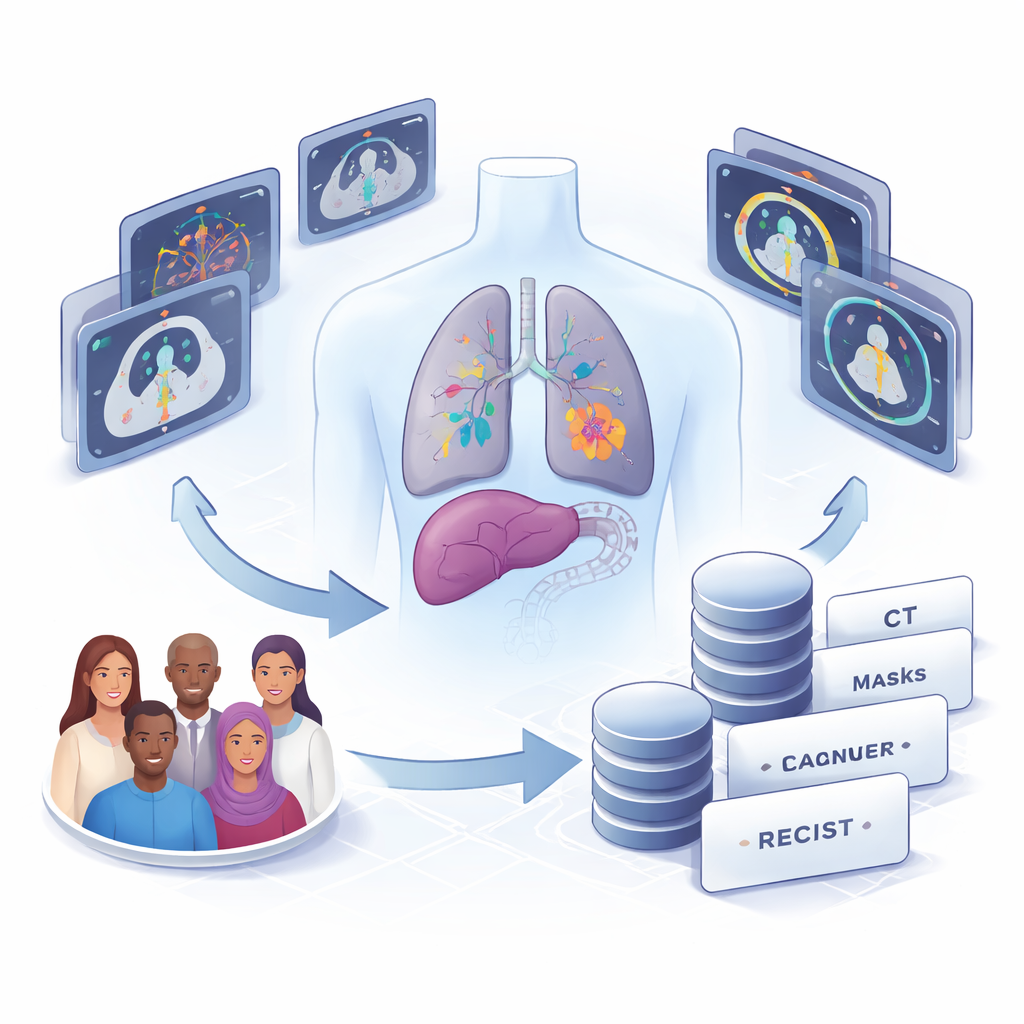
What the new CT dataset contains
The authors assembled CT scans from 22 adults treated for a variety of cancers at the Clinical Hospital of the University of Chile, including lung, liver, colorectal, breast, ovarian, gastric, gallbladder, bladder cancers and melanoma. From 58 thoracic and abdominal scan series taken between 2017 and 2023, they identified every solid tumor or enlarged lymph node large enough to measure. In total, they manually outlined 1,246 individual lesions: 1,148 metastases (tumors that have spread), 93 enlarged lymph nodes, and 5 primary tumors. For 82 of these lesions, they also included the official RECIST measurements recorded in clinical reports, allowing side‑by‑side comparison between routine practice and automated methods.
How experts and AI worked together
Producing such detailed outlines would normally be prohibitively slow, so the team used a “human‑in‑the‑loop” strategy. Experienced radiologists and residents drew rough 3‑D boxes around suspected tumors, and a powerful segmentation model called MedSAM proposed initial borders. Residents then corrected these borders, and senior radiologists performed a final review. After each batch of scans was finished, the AI model was retrained on the improved outlines and used to assist with the next batch. With every cycle, its performance crept closer to what human experts would accept, reducing the effort needed for further corrections while preserving accuracy.
What the data reveal about tumors
Because every lesion in the scans was outlined in three dimensions, the authors could study their sizes and densities in detail. Most tumors were in the lungs and liver. Lung tumors tended to be small in volume but often had relatively long diameters, while lymph nodes showed larger volumes but somewhat shorter main diameters than liver tumors. The team also examined how bright or dark these regions appeared on CT, a property related to tissue density. Lung tumors, surrounded by air, showed very different intensity patterns from liver tumors and lymph nodes, suggesting that simple numerical features from CT images could help distinguish lesion types. Importantly, the study confirmed a strong relationship between a lesion’s longest diameter and its true 3‑D volume, supporting the idea that diameter‑based rules like RECIST can act as a practical stand‑in for full volumetric measurements when carefully applied.
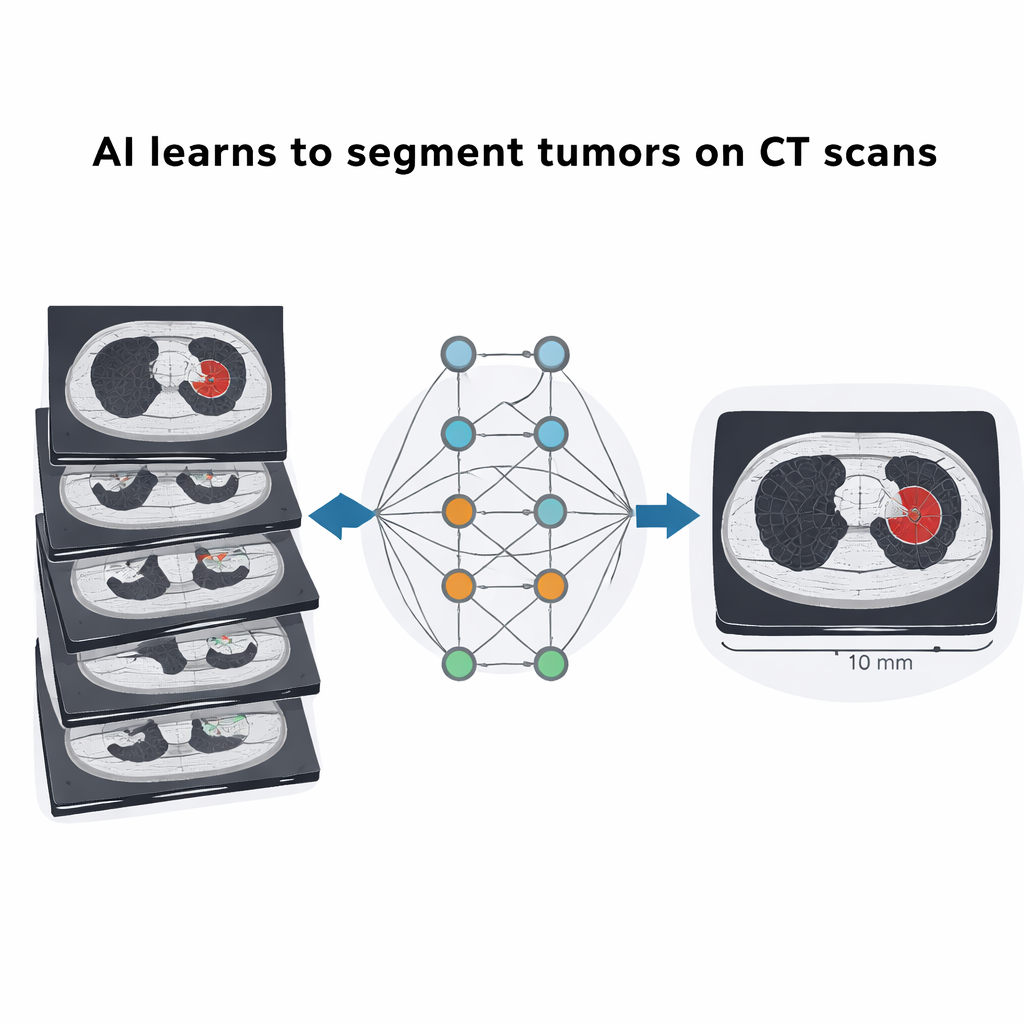
Putting the dataset to the test with deep learning
To show how the dataset can be used, the researchers trained and refined two types of deep learning systems. First, they fine‑tuned MedSAM to segment tumors automatically from simple bounding boxes, achieving overlap scores with expert outlines that were in the same range as those reported on much larger international datasets. Second, they adapted a widely used framework called nnUNet, starting from models trained on global lung and liver imaging challenges and then fine‑tuning them on this new Chilean data. After fine‑tuning, the systems matched or surpassed their original performance, particularly for lung tumors, even though the patient cohort was relatively small. This demonstrates that carefully curated local data can significantly boost the reliability of AI tools in a specific hospital setting.
What this means for future cancer care
For non‑specialists, the key message is that this dataset is an enabling tool, not a diagnostic product on its own. By openly sharing CT scans in which every visible tumor and lymph node has been outlined and, in many cases, precisely measured, the authors provide a realistic training ground for algorithms that aim to automate tumor tracking. Such tools could help radiologists spend less time on manual measurements and more time on complex judgments, while also reducing variation between readers. Because the data come from a Latin American hospital and are released under a permissive license, they also help ensure that future medical AI is tested on more diverse patients, improving the chances that automated cancer monitoring will work reliably for people around the world.
Citation: Rojas-Pizarro, R., Vásquez-Venegas, C., Pereira, G. et al. A CT Dataset with RECIST Measurements and Comprehensive Segmentation Masks for Tumors and Lymph Nodes. Sci Data 13, 270 (2026). https://doi.org/10.1038/s41597-026-06597-6
Keywords: cancer imaging, CT scans, tumor segmentation, RECIST, medical AI datasets