Clear Sky Science · en
High-resolution gridded dataset of sectoral water pollution discharges in China from 2007 to 2022
Why cleaner water maps matter
China’s rivers and lakes provide drinking water, food, and livelihoods for hundreds of millions of people, yet they have been under heavy pressure from sewage, factories, and farming. Until now, most official data showed only rough, province‑level totals for pollution, and only in a few years. This paper introduces a new, fine‑grained map of water pollution sources across mainland China, updated every year from 2007 to 2022. It shows, at roughly one‑kilometer resolution, how much pollution different activities release, helping scientists, planners, and citizens see where action is working and where hidden trouble spots remain.
Seeing pollution in much finer detail
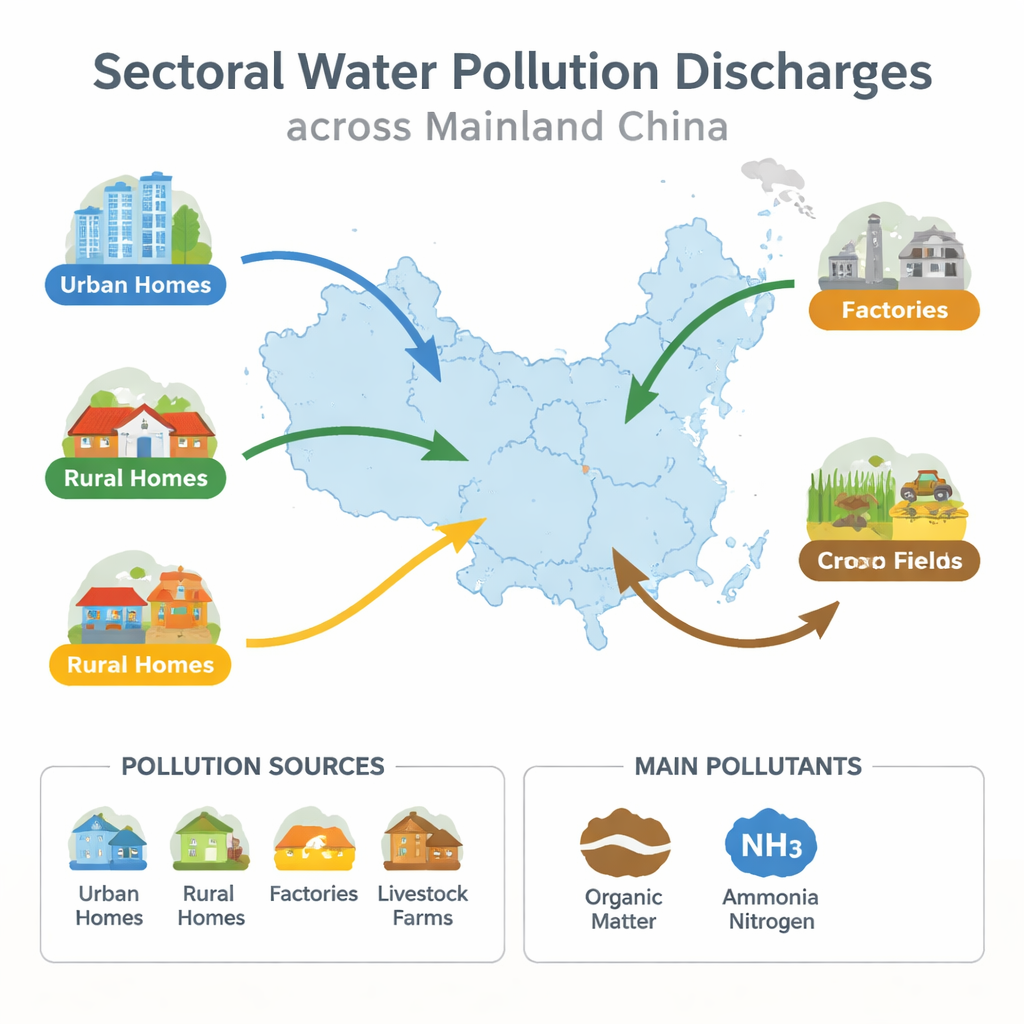
The authors built what they call a high‑resolution sectoral water pollution discharge dataset. Instead of looking only at broad national or provincial numbers, they divided mainland China into a grid of cells about one kilometer across. For each cell and each year, they estimated the amount of two key pollutants released: chemical oxygen demand (a measure of organic waste that consumes oxygen in water) and ammonium nitrogen (a form of nitrogen that is toxic to aquatic life and drives algal blooms). They tracked five major human activities that release these pollutants: urban households, rural households, industry, crop farming, and livestock farming. This turns a few scattered census snapshots into a continuous, detailed picture of how pollution pressure has shifted across the country over sixteen years.
Blending statistics, satellites, and big data
To construct these maps, the team started from China’s national pollution source censuses in 2007 and 2017, which contain the most comprehensive measurements of discharges from different sectors. They then used yearly statistics from environmental yearbooks for 2007–2022 to capture how total pollution changed over time, carefully adjusting these yearly numbers so they matched the more accurate census benchmarks. Next, they used a “top‑down” method to spread the provincial totals across the one‑kilometer grid using modern geospatial information: satellite‑derived land‑use maps, nighttime lights that reveal built‑up and well‑lit areas, detailed maps of cropland, and livestock distribution, as well as population counts and economic data. By assigning more pollution to cells with, for example, denser urban population, more factories, heavier fertilizer use, or higher livestock densities, they created realistic, spatially detailed maps for each sector and year.
What the new maps reveal
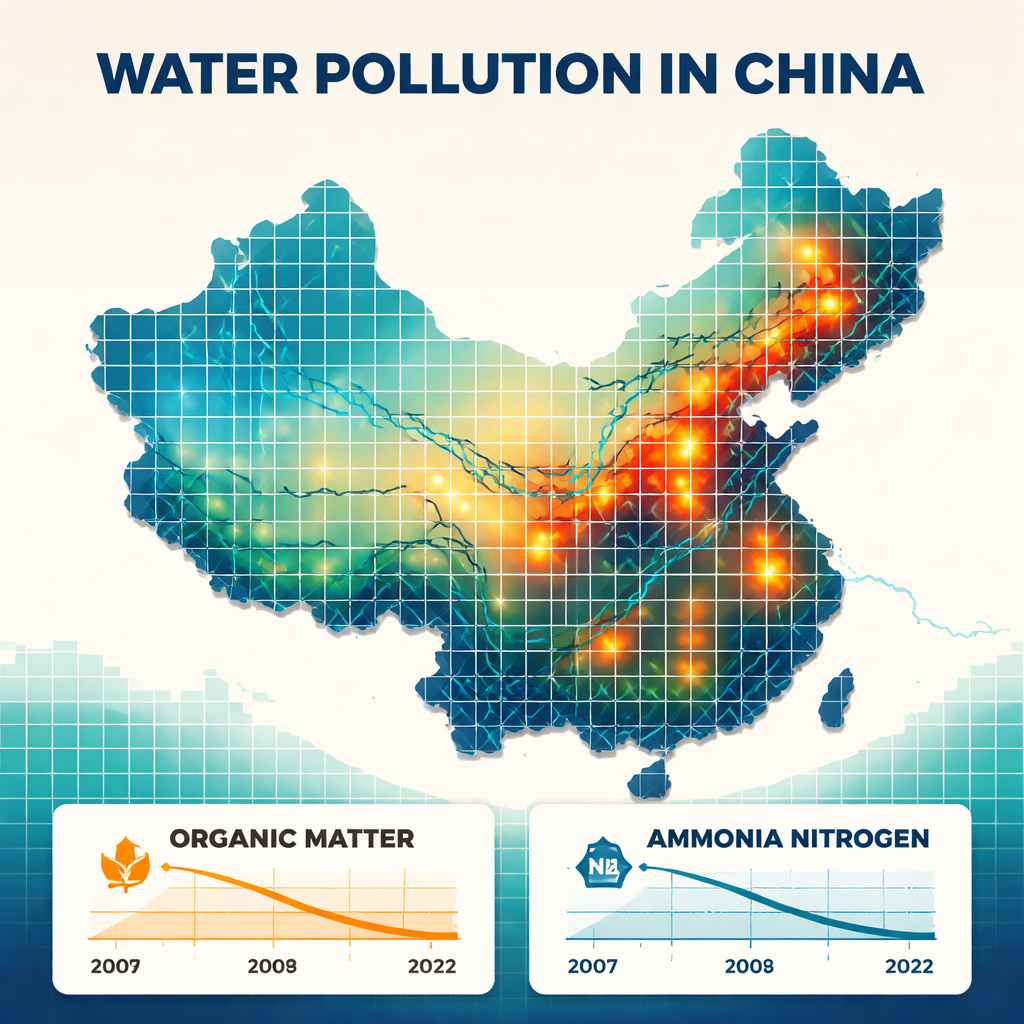
When the researchers compared their city‑level estimates with official census results for 73 cities, the agreement was strong, especially for crop farming and household pollution. This gives confidence that the new grids capture real spatial patterns, even if some uncertainty remains for complex industrial pollution. The maps show that, overall, China’s discharges of both organic waste and ammonium nitrogen have fallen steadily since 2007, reflecting major investments in sewage treatment and industrial cleanup. However, the reductions are not evenly spread. Point sources such as urban wastewater plants and factories have seen the largest and fastest cuts, while pollution from farming—both cropland fertilization and livestock manure—has declined more slowly and in some regions remains high, creating persistent hotspots in key river basins.
Linking sources to improving water quality
The authors then connected their pollution maps with long‑term records from 148 water‑quality monitoring stations across China. Using a machine‑learning approach, they explored how changes in pollution sources, climate, and landscape features together explain shifts in river water quality. The analysis suggests that reductions in point‑source discharges from cities and industry have been the main drivers of cleaner rivers in recent years, contributing more than twice as much as non‑point sources such as farms. This aligns with on‑the‑ground experience: big pipes are easier to regulate than millions of fields and small farms. At the same time, the maps highlight that future improvements will increasingly depend on better management of agricultural runoff and rural sanitation, which are more scattered and harder to control.
How this helps protect rivers and people
For non‑specialists, the key takeaway is that this new dataset acts like a high‑resolution weather map for water pollution. Instead of vague averages, it pinpoints where pollution is generated, how it has changed year by year, and which sectors are responsible. Policymakers can use it to focus limited resources on the worst hotspots, design fairer regulations, and test whether past policies worked as intended. Scientists can plug the data into river and lake models to predict how much pollution will actually reach sensitive ecosystems and to explore future scenarios. Although it currently tracks only two pollutants and works at annual time steps, this resource marks a major step toward more transparent, evidence‑based water protection in China—and offers a template that other countries can follow.
Citation: Yuan, Z., Ma, T. High-resolution gridded dataset of sectoral water pollution discharges in China from 2007 to 2022. Sci Data 13, 271 (2026). https://doi.org/10.1038/s41597-026-06595-8
Keywords: water pollution, China rivers, wastewater, agricultural runoff, environmental data