Clear Sky Science · en
Street- and census-level NO2 data for Barcelona with uncertainty and exceedance probability mapping
Why City Air on Your Street Matters
For most city dwellers, air pollution is something you hear about in headlines, not at the level of your own street. Yet the air you breathe can change sharply from one block to the next, and health guidelines are becoming stricter. This study delivers a detailed, six‑year picture of nitrogen dioxide (NO₂) pollution in Barcelona, zooming down to individual streets and neighborhoods, and crucially, it also tells us how confident we can be in those estimates. That combination makes the work valuable not just for scientists, but for residents, doctors, planners, and policymakers.
Seeing the Invisible Gas
Nitrogen dioxide is a pollutant closely tied to traffic and is linked to asthma, heart disease, and premature death. Traditional monitoring relies on a small number of fixed stations scattered around a city. These stations are precise, but they cannot capture how pollution varies from one side of a busy road to a quiet side street, or how it shifts from day to day in every neighborhood. Satellite data offer a wider view, but with coarse resolution and measurements high in the atmosphere rather than at breathing level. As air quality rules tighten in Europe and the World Health Organization lowers its recommended limits, cities need a more detailed and trustworthy map of where and when NO₂ exceeds those limits.
Building a Street‑Level Map
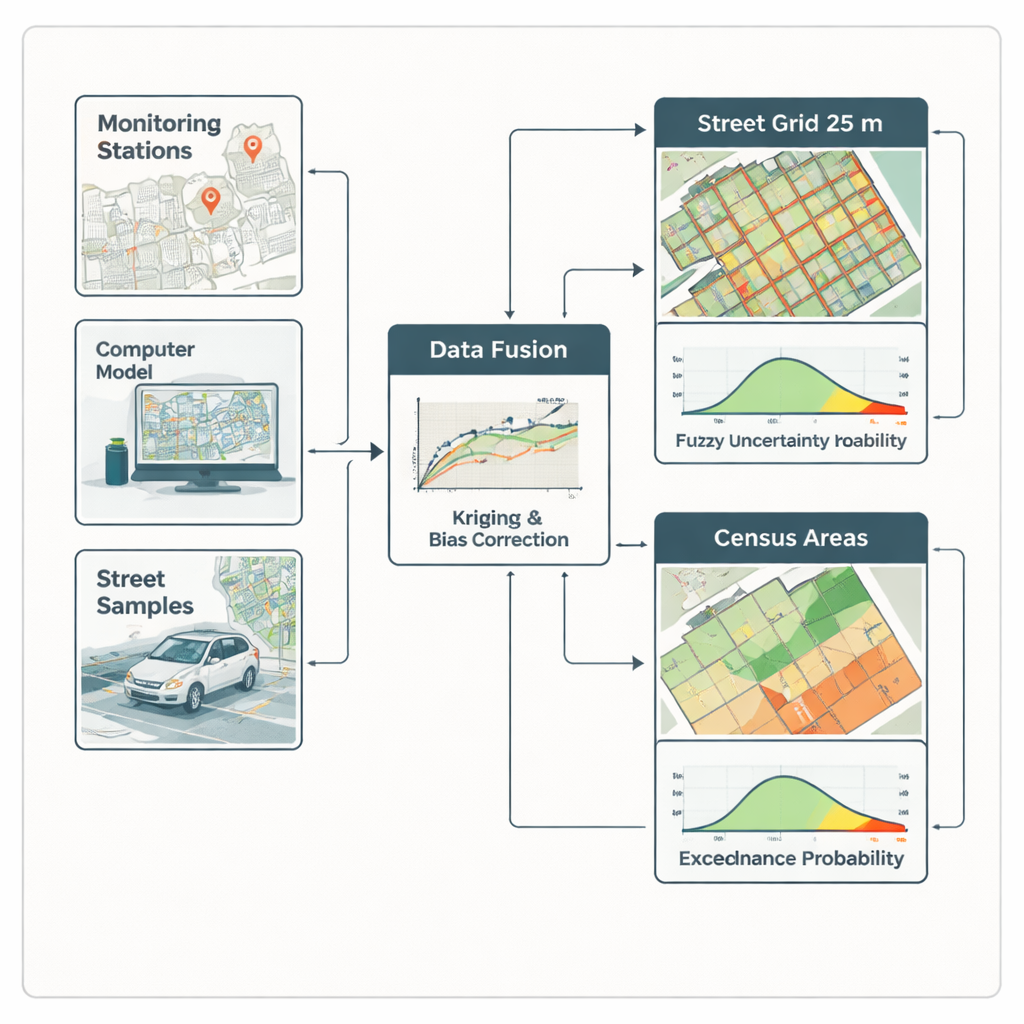
The authors merged several complementary data sources to overcome the blind spots of any single method. They started with an advanced urban air quality model that simulates hourly NO₂ levels across Barcelona using information on weather, traffic, and emissions. They added observations from official monitoring stations, which provide accurate ground truth at a few locations, and from special “passive sampler” campaigns that measured NO₂ at hundreds of street points for several weeks at a time. Using a statistical technique known as data fusion, they combined these streams so that model results are nudged toward real measurements and fine‑scale street patterns are preserved.
From Raw Data to Useful Views
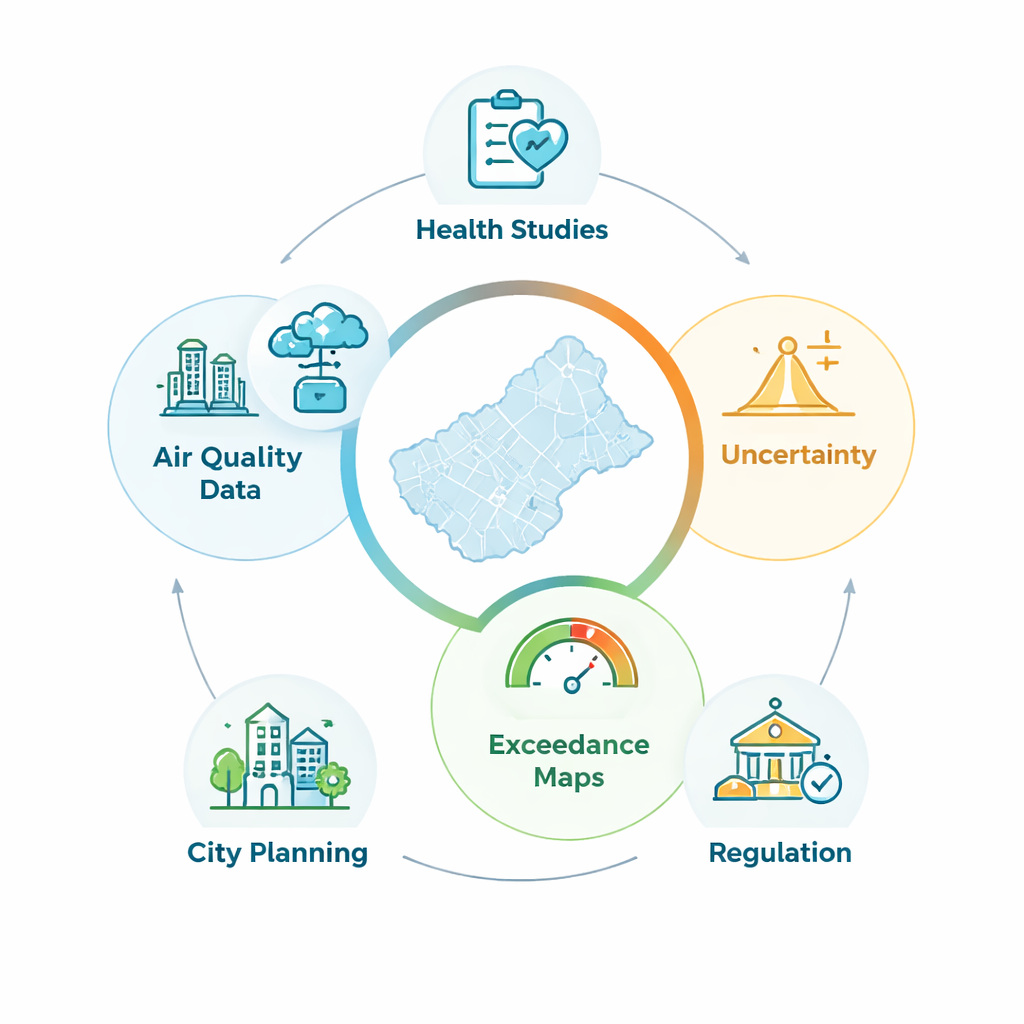
The outcome is two interconnected datasets covering 2019–2024. One provides annual average NO₂ on a fine grid of 25 by 25 meters—roughly the size of a short urban block—revealing how pollution hugs main roads, spreads into side streets, and responds to policy changes such as low‑emission zones or redesigned “superblocks.” The second groups the data by census tract and includes both daily and annual averages, making it directly compatible with health, demographic, and social statistics. For each grid cell or census area, the database not only reports the best estimate of NO₂ but also the chance that pollution exceeds specific daily or yearly limits set by the European Union and WHO guidelines. This “exceedance probability” turns complex statistics into a simple risk indicator, such as the likelihood that a neighborhood often breathes air above safe levels.
Putting Numbers on Uncertainty
A distinctive feature of this work is that it treats uncertainty as a first‑class citizen rather than an afterthought. Every estimate comes with a quantified range that reflects how well the model and data can constrain NO₂ at that place and time. Where measurements are dense and conditions are typical, uncertainty is smaller; where monitoring is sparse or conditions unusual, it grows. The team tested their approach by repeatedly withholding data from individual monitoring stations and checking how well the system could predict them. On both daily and yearly scales, predicted values tracked observations well, with typical errors of a few micrograms per cubic meter. Interestingly, the method tends to err on the safe side by slightly overstating uncertainty for busy traffic sites—helpful when these maps are used for health assessments or regulation.
What This Means for People and Policy
For non‑specialists, the key message is that we can now see, with quantified confidence, how NO₂ pollution behaves across all of Barcelona’s streets and neighborhoods day by day over six years. Residents can explore how their local air compares to health guidelines, city officials can pinpoint hotspots and evaluate whether new policies are working, and researchers can link detailed exposure estimates with health and social data. By packaging both pollution levels and their uncertainty into an open, easy‑to‑use platform, this study offers a blueprint for cities worldwide that want to turn invisible air into actionable knowledge.
Citation: Criado, A., Carnerero, C., Frangeskou, A. et al. Street- and census-level NO2 data for Barcelona with uncertainty and exceedance probability mapping. Sci Data 13, 266 (2026). https://doi.org/10.1038/s41597-026-06592-x
Keywords: urban air pollution, nitrogen dioxide, Barcelona, health impact, open data