Clear Sky Science · en
A dataset of real-world oscillograms from electrical power grids
Why tiny electrical hiccups matter
Every second, vast power grids quietly keep our lights on, hospitals running, and data centers humming. Hidden inside substations, protective devices constantly listen to the grid’s heartbeat—voltage and current signals that reveal whether things are healthy or on the verge of failure. This article describes a new, publicly available trove of these “heartbeats,” a dataset of real-world oscillograms that capture how power systems behave during normal operation, minor disturbances, and serious faults. It is designed to help engineers and artificial intelligence systems make our electricity supply more reliable and resilient.
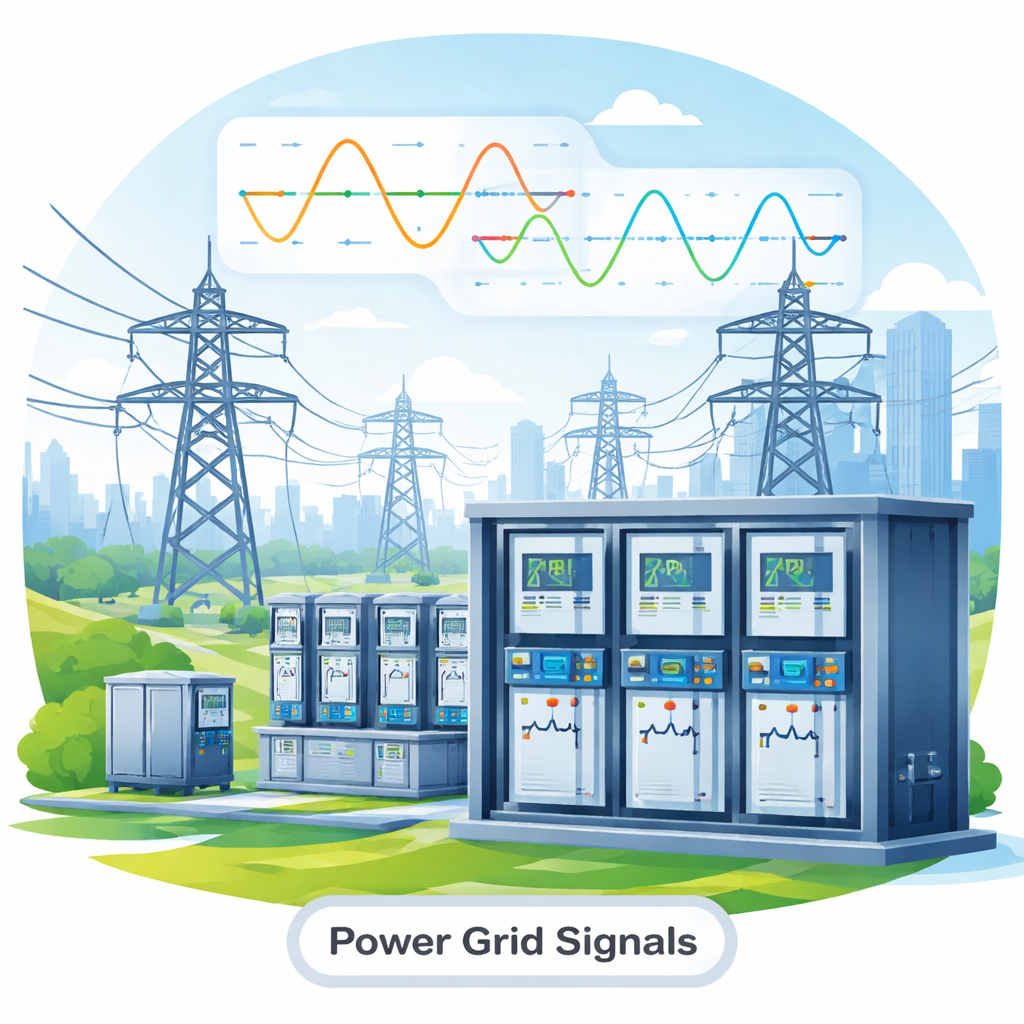
Listening in on the grid
Modern substations are filled with relay protection and automation terminals, devices that watch the grid and instantly trigger circuit breakers when something goes wrong. As power systems grow more complex—with fluctuating demand, renewable sources, and sensitive electronics—these relays need to distinguish harmless fluctuations from dangerous faults in fractions of a second. They do this by recording oscillograms: detailed time series of voltages and currents sampled thousands of times per second. Until now, most research and many AI-based protection schemes have relied heavily on synthetic, computer-generated signals that cannot fully reproduce the messiness of real networks, such as sensor errors, unpredictable loads, or lightning-induced disturbances.
A large real-world signal library
The authors assembled a dataset of 50,765 oscillograms collected from industrial substations, mostly in medium-voltage networks between 0.4 and 35 kilovolts. These records come from routine commissioning of equipment and from investigations of actual events in the grid. All files are stored in the standard COMTRADE format widely used in the power industry and are also provided as preprocessed CSV files for data analysis and machine learning. To protect privacy and commercial information, the team removed names of facilities and manufacturers, recording dates, and original file names, and they standardized the way signals are labeled so that users see a consistent set of voltage and current channels regardless of device brand or substation layout.
Making sense of the signals
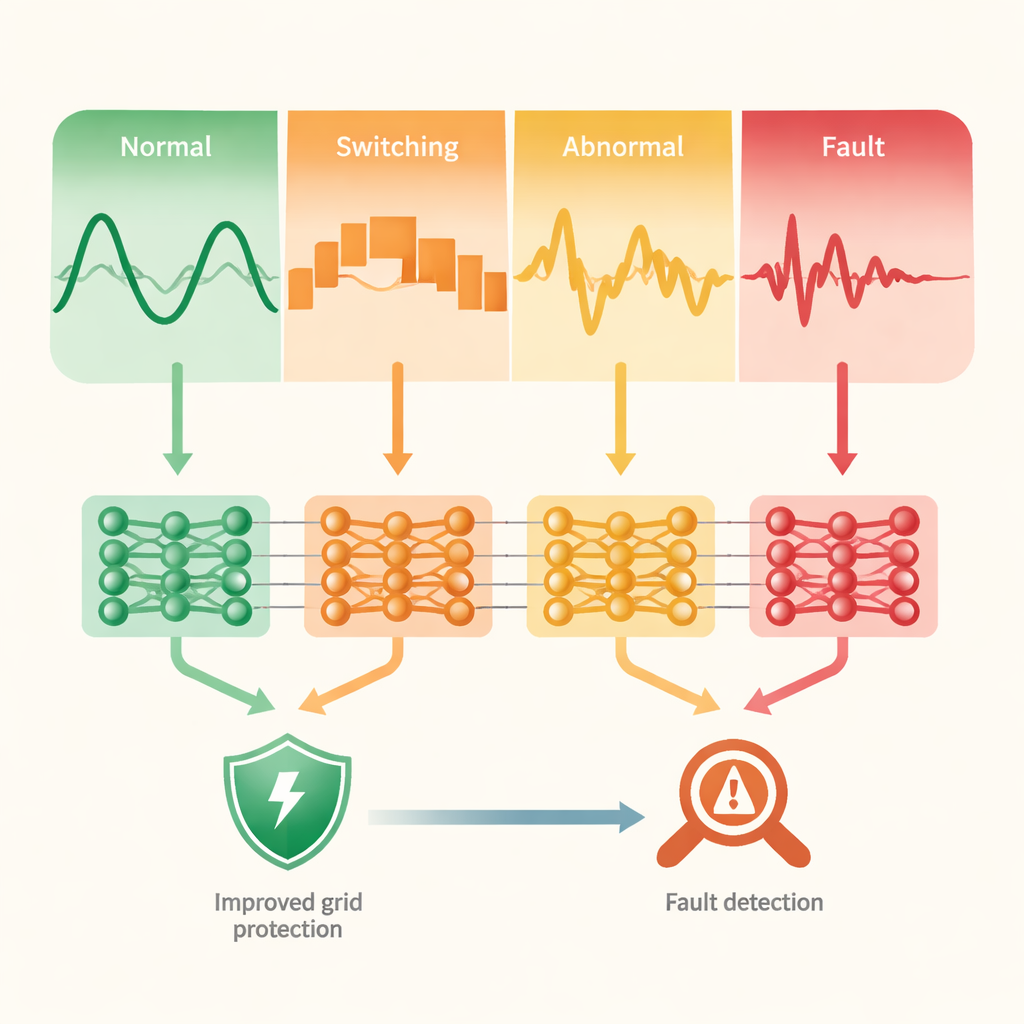
A carefully selected subset of 480 oscillograms received detailed human annotation. Experts reviewed the analog signals and divided every moment in time into four intuitive groups: normal operation or pure noise, routine switching operations such as breakers opening or motors starting, abnormal events that deviate from regulations but do not require immediate shutdown, and serious fault events that should trigger protection devices. This fine-grained labeling allows researchers to train and test algorithms that not only detect that “something happened” but also recognize what kind of event it was. The team also filtered the broader collection to identify more than 20,000 oscillograms that contain clear disturbances, providing a focused starting point for those interested in unusual behavior.
From raw waves to smarter protection
To check the quality of their labels, the authors trained several types of neural networks on the annotated subset. First, they used an autoencoder—an AI model that compresses signals into a compact internal description and then reconstructs them—to learn features directly from the waveforms. When these compressed descriptions were visualized, the four event categories formed clearly separated clusters, showing that the expert labels captured real differences in the signals. Standard classifiers such as convolutional and recurrent networks were then able to recognize the four event types with strong accuracy, especially for abnormal and fault events. This demonstrates that the dataset is well suited for developing and benchmarking machine learning methods for grid monitoring.
Building a foundation for future grid intelligence
For non-specialists, the key takeaway is that this dataset offers a realistic laboratory for improving how we protect and control power grids. Because it includes both labeled and unlabeled data, and because the processing tools are openly released, researchers can explore everything from basic anomaly detection to advanced adaptive protection schemes that adjust themselves to changing grid conditions. Over time, models trained and validated on these real oscillograms could help utilities detect problems earlier, reduce blackouts, and integrate more renewable generation safely—making the invisible infrastructure behind everyday life more robust and intelligent.
Citation: Evdakov, A., Filatova, G., Yablokov, A. et al. A dataset of real-world oscillograms from electrical power grids. Sci Data 13, 262 (2026). https://doi.org/10.1038/s41597-026-06587-8
Keywords: power grid reliability, fault detection, oscillogram dataset, relay protection, machine learning in energy