Clear Sky Science · en
GlobalBuildingMap — Unveiling the mystery of global buildings
Why Mapping Our Buildings Matters
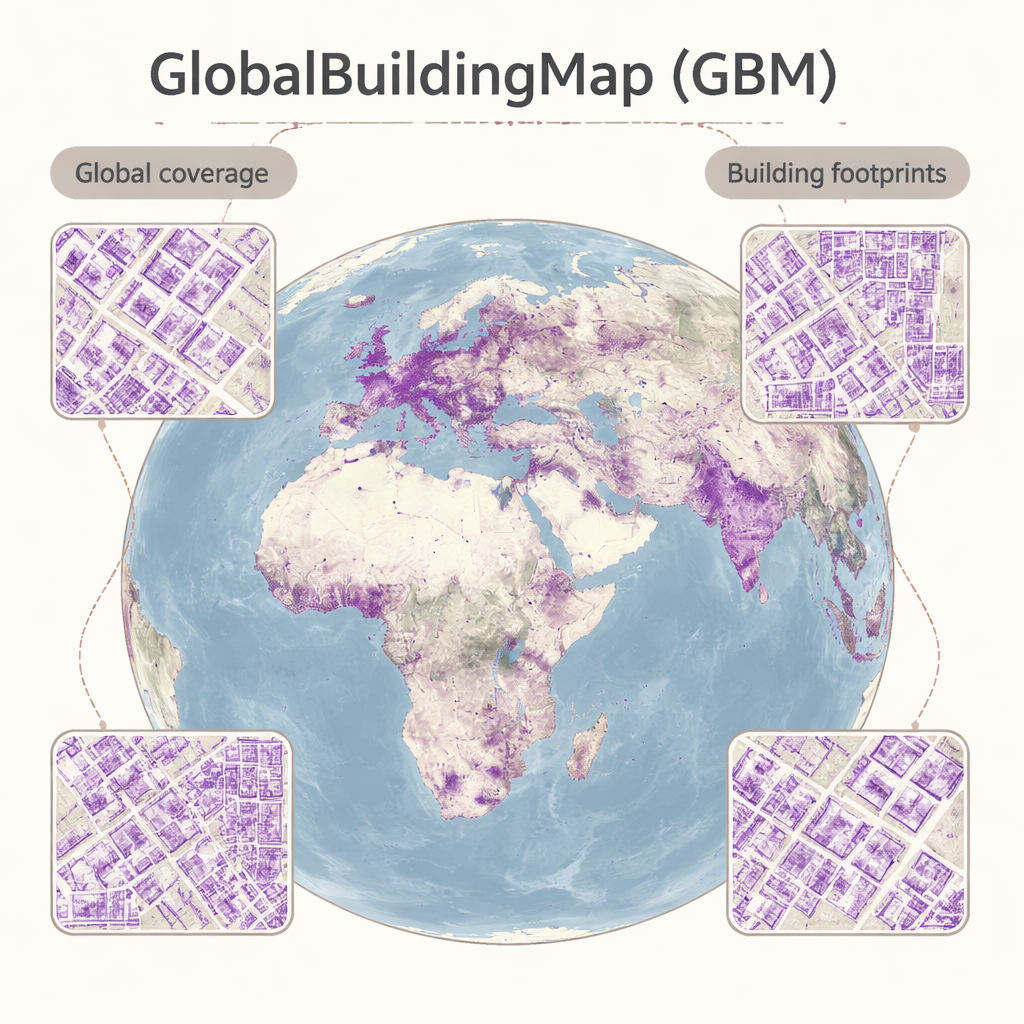
Every human story takes place in and around buildings—homes, schools, hospitals, factories. Yet until recently, we did not have a complete, detailed picture of where all these structures actually are on Earth. This paper introduces the GlobalBuildingMap (GBM), the first high-accuracy, high‑resolution map of buildings worldwide. Beyond pure curiosity, such a map can reshape how we plan cities, prepare for disasters, and even estimate how much of the world’s energy needs could be met by rooftop solar panels.
Seeing the Human Footprint from Space
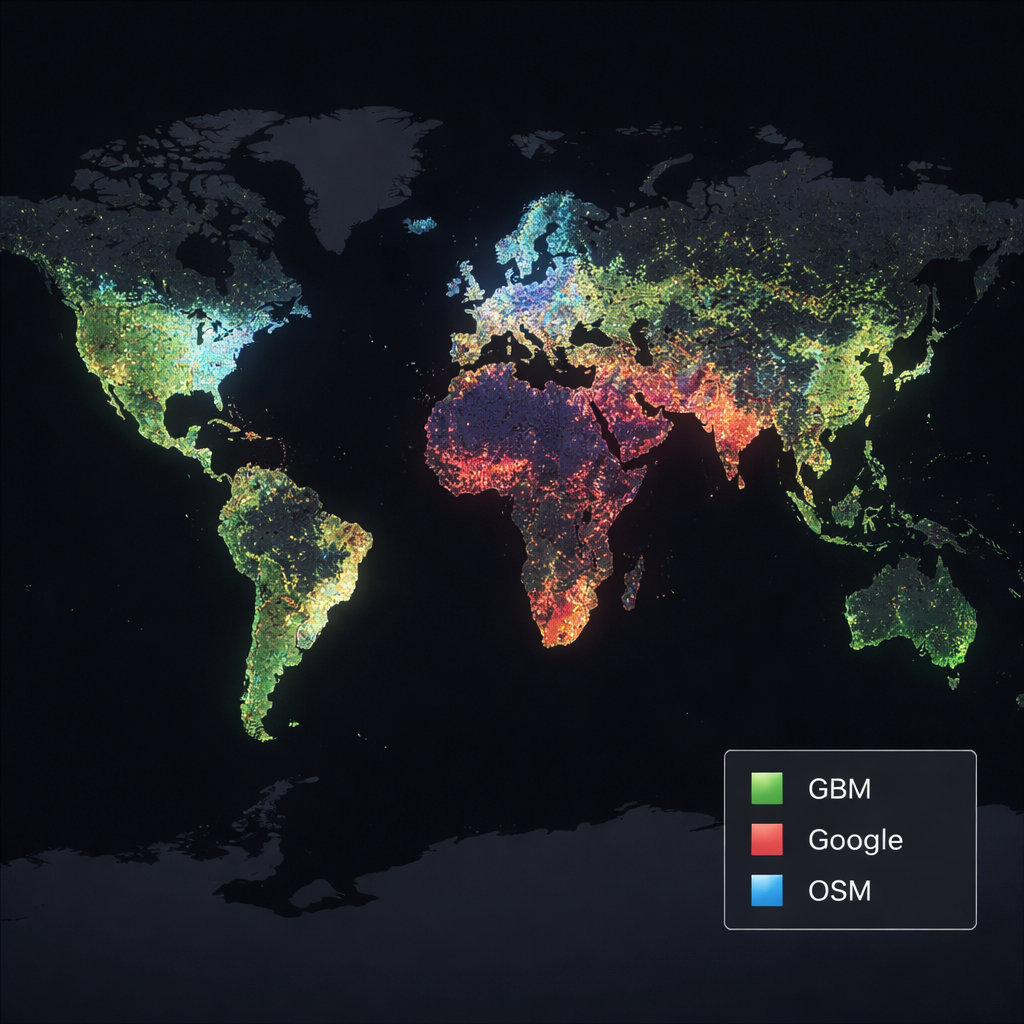
Human-made structures cover only a small slice of the planet’s surface, but they drive a large share of its environmental and social change. Buildings influence local climate, flood risk, traffic, access to services, and greenhouse‑gas emissions. More than half of the world’s population now lives in urban areas, yet previous global maps of settlements were too coarse to pick out smaller houses, informal neighborhoods, or temporary shelters. Existing datasets from projects like OpenStreetMap, Google, and Microsoft either miss huge regions, rely on volunteers, or lack uniform quality. GBM was designed to close this gap by offering a consistent, building‑level view of human settlements everywhere on Earth.
How the New World Building Map Was Built
To create GBM, the researchers assembled nearly 800,000 high‑resolution satellite images from the PlanetScope constellation, each pixel representing an area about the size of a small room (3 meters). They then trained four advanced computer‑vision models—types of deep neural networks—to tell building pixels from non‑building pixels. For training, they used more than 100,000 carefully checked pairs of satellite image patches and building outlines from 74 cities across the globe. A team manually cleaned these data to fix misalignments and remove missing or incorrect building outlines, making sure the “ground truth” was as reliable as possible.
From City Blocks to a Global Picture
Once trained, the models were unleashed on the planet in a big‑data processing pipeline. Global settlement masks guided where to look for buildings, and cloud‑free satellite images were stitched and radiometrically calibrated so that the models could handle wildly different lighting and building materials. Each image was run through all four models, and a pixel was only labeled as building if at least two models agreed. This ensemble approach reduced random errors and improved generalization to regions not seen during training. Finally, the team filtered out false alarms using independent land‑cover maps, distinguishing true buildings from bright fields, bare soil, or other confusing surfaces.
What the Map Reveals About Our Built World
The finished GBM shows that buildings worldwide cover about 0.67 million square kilometers—more than twice earlier estimates based on coarser, indirect methods. Because GBM works at 3‑meter resolution, it can capture fine‑grained patterns: dense urban cores, scattered rural homes, and informal settlements that were often invisible before. Compared with other products, GBM stands out as the only complete global map, with especially strong coverage in East Asia and parts of Africa where other datasets are sparse. This level of detail opens new possibilities in population mapping, risk assessment, and tracking urban growth, all based on real building footprints instead of rough statistical guesses.
Rooftops as a Global Power Plant
Armed with this detailed building map, the authors asked a practical question: could rooftop solar panels on all buildings meet humanity’s energy demand? By combining GBM with the World Bank’s Global Solar Atlas—an assessment of how much sunlight different regions receive—they estimated how much electricity could be generated if roofs worldwide hosted solar panels of realistic efficiency. Their calculations suggest that rooftop solar could produce 28–84 petawatt‑hours of energy per year, or roughly 1.1 to 3.3 times the entire world’s energy use in 2020. While this is a simplified, “best‑case” scenario that ignores roof orientation, shading, and other obstacles, it strongly supports the idea that rooftop solar could be a central pillar of a clean energy future.
A New Foundation for Future Planning
To a non‑specialist, the key message is straightforward: for the first time, we have a detailed, global x‑ray of where buildings actually stand on Earth. This map shows that earlier estimates of built area were too low and that the potential of rooftops for solar energy is enormous—enough, in principle, to power the world. Beyond energy, the GlobalBuildingMap offers a powerful new tool for city planners, climate scientists, emergency managers, and anyone who needs to understand where people live and work. As satellite data and artificial intelligence continue to improve, such maps will only become sharper, updated more often, and even more central to decisions about how we shape our shared planet.
Citation: Zhu, X.X., Li, Q., Shi, Y. et al. GlobalBuildingMap — Unveiling the mystery of global buildings. Sci Data 13, 71 (2026). https://doi.org/10.1038/s41597-026-06578-9
Keywords: global building map, satellite imagery, urbanization, rooftop solar energy, deep learning