Clear Sky Science · en
Global OMI HCHO Level-3 oversampling dataset: high spatial resolution and lightweight uncertainty
Why Watching Invisible Air Pollutants Matters
Formaldehyde in the air is invisible, but it quietly shapes both our health and the chemistry of the atmosphere. It is toxic, can contribute to cancer risk, and plays a key role in forming smog and haze. Yet until recently, scientists struggled to track this gas in fine detail across the globe. This article describes a new high‑resolution, long‑term dataset built from satellite observations that lets researchers see formaldehyde patterns more clearly than ever before, helping to pinpoint pollution sources and better understand how our activities affect air quality and climate.
A Long Look at a Short‑Lived Gas
Formaldehyde in the lower atmosphere is produced mainly when sunlight breaks down other gases, especially volatile organic compounds released by forests, fires, fuels, and industry. Because formaldehyde does not last long, its concentration gives a near real‑time picture of these precursor emissions. For nearly two decades, NASA’s Ozone Monitoring Instrument (OMI) has measured formaldehyde from space, building a uniquely long global record. However, the original OMI products have coarse pixels tens of kilometers wide and large uncertainties, which makes it hard to identify city‑scale emission hotspots or confidently track trends. The new dataset, called OMHCHOS V1.0, is designed to fix these limitations while keeping the full 2005–2023 time span.
Turning Many Blurry Snapshots into a Sharper Picture
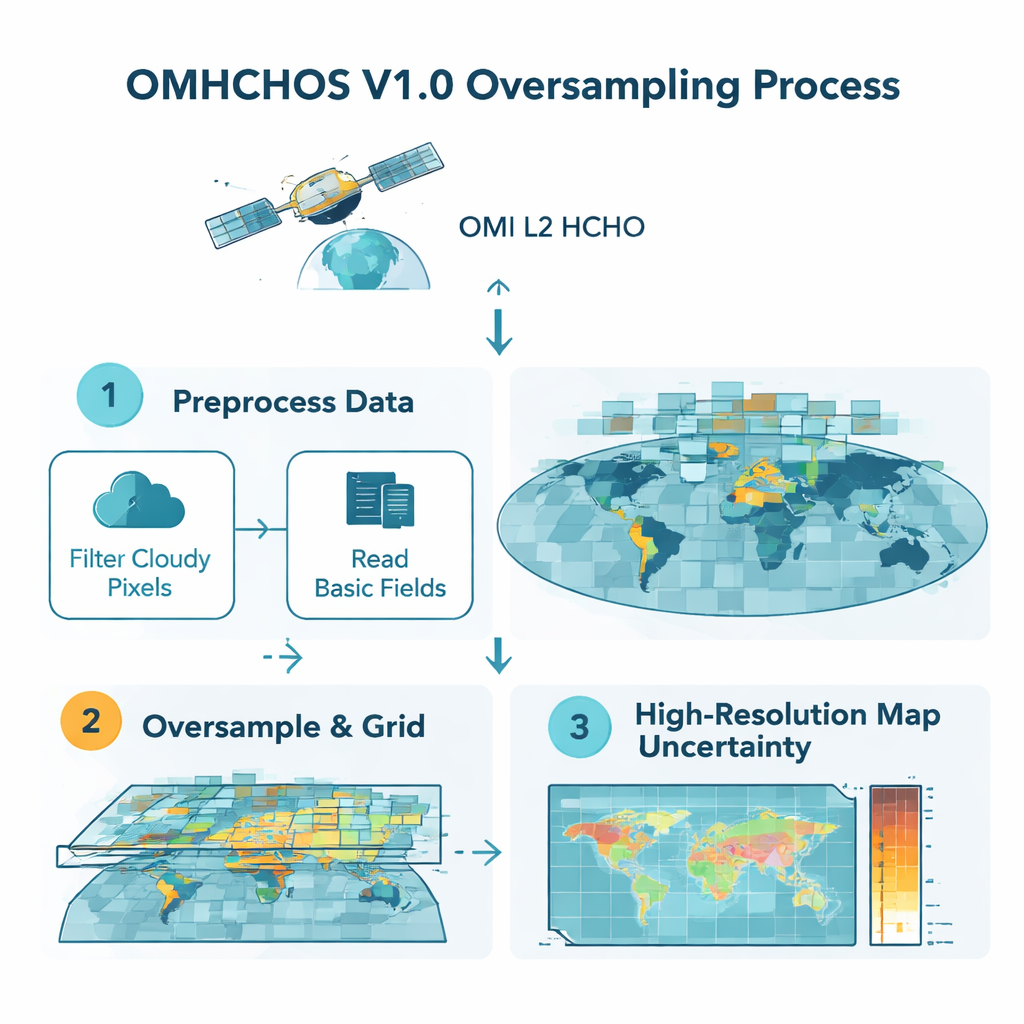
The core idea behind OMHCHOS is “oversampling” – combining many overlapping satellite passes to sharpen the view. Each OMI orbit sees Earth in elongated pixels with strongest sensitivity at the center and weaker response at the edges. Instead of treating each pixel as a uniform block, the authors model the pixel’s internal response and how it overlaps a much finer grid. By stacking data from tens of thousands of orbits and carefully weighting how much each pixel contributes to each grid cell, they generate maps with resolutions as fine as about 5 kilometers. At the same time, they track how measurement errors propagate through this process so that every grid cell carries not just a value, but also a quantitative uncertainty.
From Raw Orbits to User‑Friendly Maps
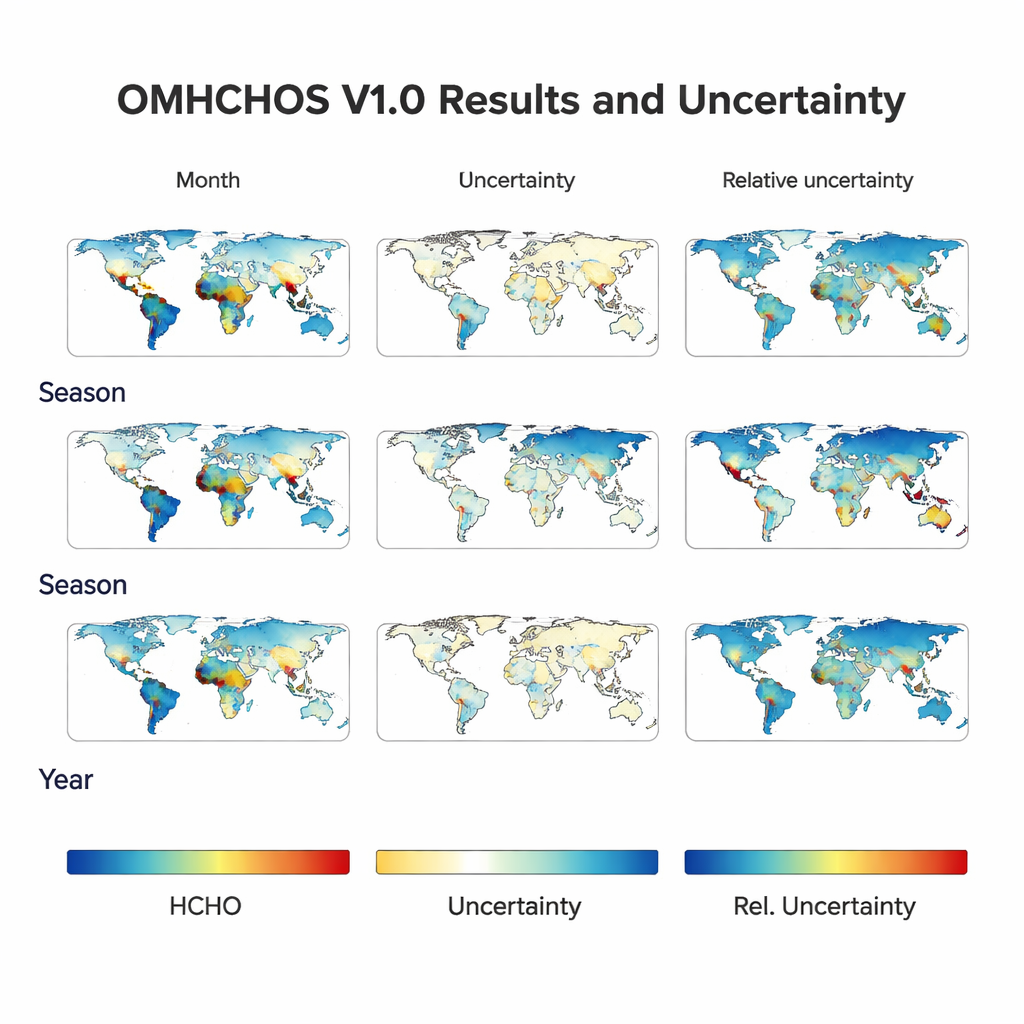
Building this global product required processing nearly 100,000 orbits of raw Level‑2 OMI formaldehyde data using a custom algorithm written in Fortran and driven from R and shell scripts. The team first screens out problematic pixels—those with too much cloud, extreme viewing angles, or known instrumental issues—then performs the oversampling calculations at user‑selectable grid sizes. The result is a flexible Level‑3 dataset offering seven spatial resolutions (from 0.05° to 1.0°) and twelve temporal resolutions (from one to twelve months). Each combination yields three matched layers: the average formaldehyde column, its uncertainty, and the relative uncertainty. Files are provided in both RData and NetCDF formats, along with ready‑made global maps so users can quickly inspect data quality and patterns.
Testing Accuracy Against Other Eyes on the Atmosphere
To show that the new maps are trustworthy, the authors compare OMHCHOS with several independent references. Against an existing gridded OMI product from NASA, the oversampled data show very high correlations across continents and in carefully chosen high‑ and low‑emission regions. Differences, measured by standard error statistics, are generally small and often better than or comparable to past satellite‑validation studies. Ground‑based telescopes (MAX‑DOAS instruments) at suburban and urban sites in China and Europe reveal that the new dataset closely tracks month‑to‑month variations in local formaldehyde, with a modest but consistent underestimation that can be corrected. Comparisons with a detailed chemical transport model (GEOS‑Chem) also show broad agreement in where and when formaldehyde is elevated, especially over biomass‑burning regions and densely populated areas.
Choosing the Right Detail for the Job
Different scientific and policy questions require different trade‑offs between spatial detail, time averaging, and uncertainty. To guide users, the team builds a three‑dimensional “optimization” model that relates grid size, averaging period, and typical relative uncertainty. In simple terms, very fine grids and short averaging (for example, monthly 0.05° maps) give sharp pictures but higher uncertainty, while coarser grids and longer averaging reduce noise dramatically. The authors condense this behavior into look‑up tables that suggest suitable settings—for instance, which grid sizes and time windows to choose if one wants relative uncertainty below 10% for global studies, or how to relax uncertainty when tracking small‑scale hotspots near cities or fires.
Clearer Maps for Cleaner Air
For non‑specialists, the main message is that this work turns a vast but imperfect stream of satellite measurements into a sharper, more reliable atlas of a key air pollutant. By offering kilometer‑scale coverage, quantified uncertainties, and flexible choices of space and time scales, the OMHCHOS dataset makes it easier to identify where formaldehyde—and by extension, its precursor gases—are highest, how they change over seasons and years, and how they respond to events like wildfires, industrial growth, or lockdowns. These clearer maps can support better air‑quality management and more robust health risk assessments, while also helping scientists untangle the complex chemistry that links human activity, natural emissions, and the air we breathe.
Citation: Xia, H., Wang, D., Yang, X. et al. Global OMI HCHO Level-3 oversampling dataset: high spatial resolution and lightweight uncertainty. Sci Data 13, 253 (2026). https://doi.org/10.1038/s41597-026-06577-w
Keywords: satellite air quality, formaldehyde pollution, remote sensing data, atmospheric chemistry, global emissions