Clear Sky Science · en
National coastal wetland mapping over the last four decades: An annual classification with high accuracy
Why Mapping Hidden Coastal Habitats Matters
Along the edge of the sea, where land, water, and tide constantly trade places, lie coastal wetlands—mangrove forests, salt marshes, and muddy tidal flats. These thin green and gray strips protect cities from storms, shelter migratory birds, and quietly lock away vast amounts of carbon. Yet they are under pressure from climate change, invasive plants, and rapid development. This study delivers the most detailed, year-by-year maps of China’s coastal wetlands over the past four decades, giving scientists and policymakers a powerful new tool to see what has been lost, what has been restored, and what still can be saved. 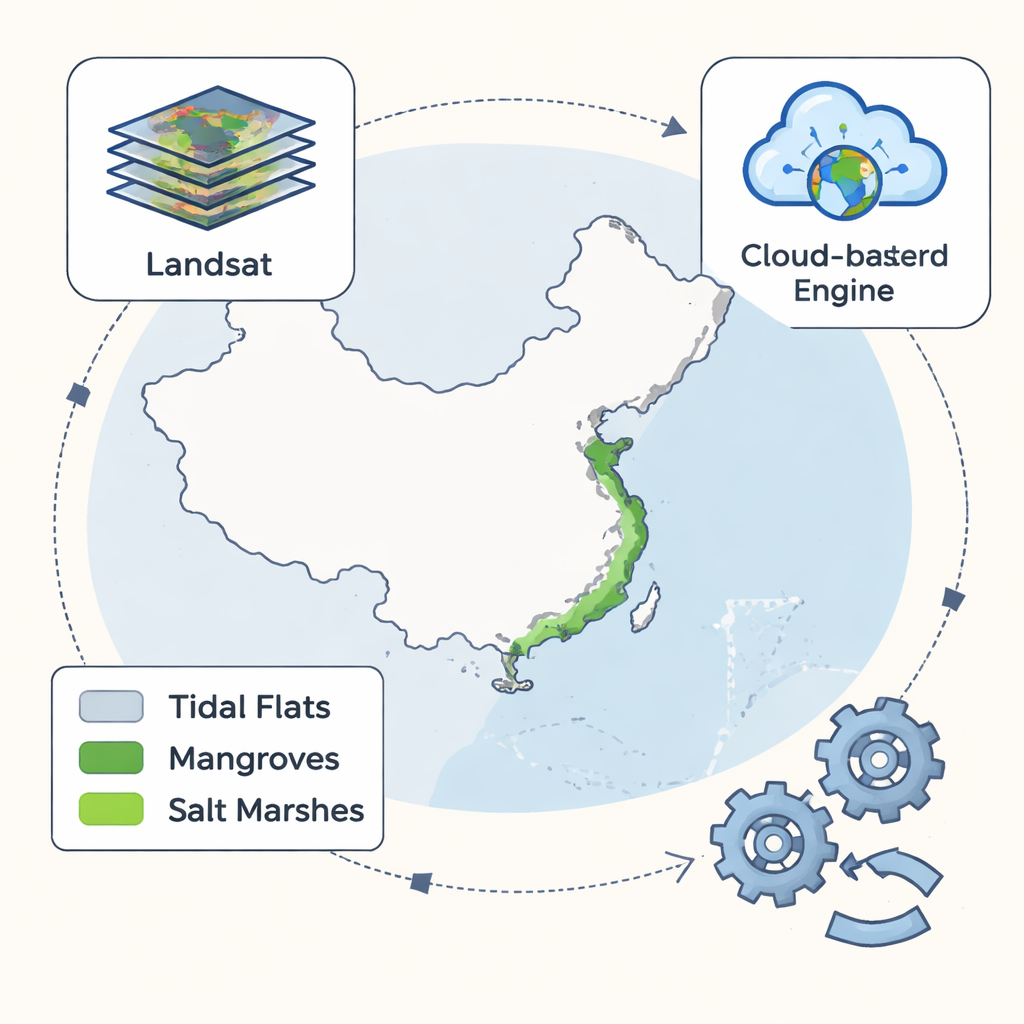
The Living Barrier Between Land and Sea
Coastal wetlands cover less than 1% of Earth’s surface, but their importance far outweighs their size. Mangroves and salt marshes act like living seawalls, reducing wave energy and storm surges that threaten coastal communities. They also serve as nurseries and feeding grounds for fish and migratory birds that link continents. Perhaps most crucially, these ecosystems are part of the so-called “blue carbon” network, storing billions of tons of carbon in their soils and vegetation and helping slow climate change. Losing them does not just erase habitat—it also releases carbon back into the atmosphere and weakens nature’s own climate defense system.
Threats From Heat, Rising Seas, and Human Hands
These valuable habitats face a growing list of threats. Hotter temperatures and faster sea-level rise put low-lying wetlands at risk of drowning or retreating inland, but space to move is often blocked by seawalls and cities. Climate projections suggest that at 2 °C of global warming, about half of the world’s coastal wetlands will be directly exposed to rising seas, and at 3 °C, roughly 70% could be affected. In China, the story is further complicated by the spread of an invasive grass, Spartina alterniflora, which has expanded fivefold in 40 years and can crowd out native plants. At the same time, coastal urbanization, aquaculture ponds, and farmland reclamation have eaten away at mangrove belts and salt marshes. Efforts to restore wetlands and remove invasive plants have begun, but their true impact is hard to measure without consistent, long-term data.
Turning Space Images Into Yearly Wetland Maps
Traditional monitoring by field teams is too slow and costly to track every kilometer of coastline year after year. Instead, the authors tapped decades of satellite observations from the Landsat program, which has been imaging Earth since the 1970s at a resolution of about 30 meters—fine enough to distinguish major coastal habitats. Using Google Earth Engine, a cloud platform that can handle massive image collections, they processed more than 60,000 satellite scenes from 1985 onward. They combined three techniques into a single workflow: a method that picks out each pixel’s strongest water and vegetation signals over a year, an automatic thresholding approach to separate land and water zones, and a machine-learning classifier that learns from hundreds of field-checked sample sites to distinguish mangroves, salt marshes, and tidal flats.
How the New Method Raises the Bar
The team’s “MSIC–OA–RF” framework—named for its three main steps—first builds composite images that emphasize maximum water and vegetation extent, then uses an automated rule to outline likely wetland areas, and finally applies a random forest model to label different vegetation types. They carefully mapped China’s coastline itself, separating natural shores from built-up structures, so that inland farms or forests would not be mistaken for wetlands. Extensive field campaigns in 2024, along with earlier surveys and high-resolution imagery, supplied nearly a thousand reference sites for training and testing the model. The result is an annual series of coastal wetland maps from 1985 to 2024, with an average overall accuracy of about 97.6% and a Kappa score—a measure of mapping reliability—of 0.957, consistently high across four decades. 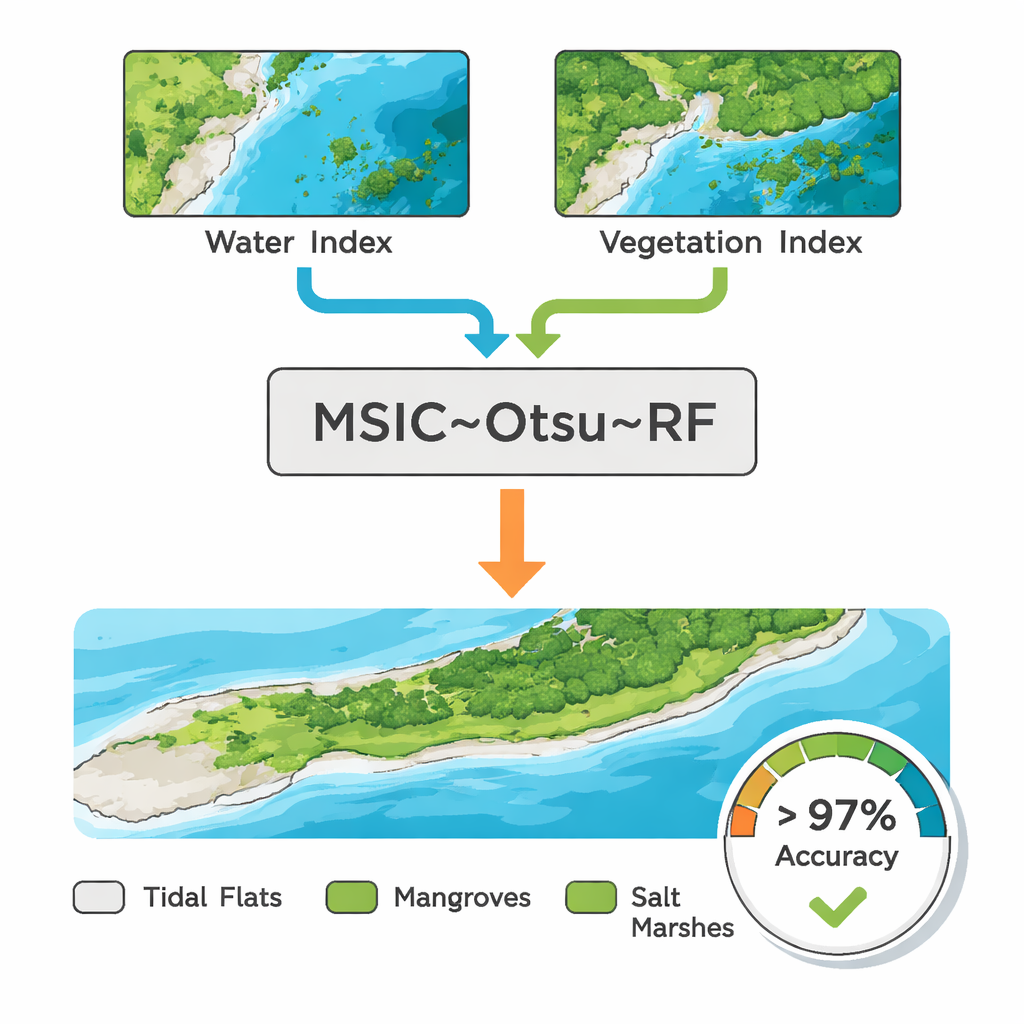
What These Maps Reveal and How They Can Be Used
By comparing their product with other widely used global and national datasets, the authors show that their maps better capture the true spread of coastal vegetation and more clearly separate coastal wetlands from ordinary terrestrial greenery. In fast-changing deltas like the Yellow River and Qiantang River estuaries, the new maps reveal where protected areas have allowed wetlands to expand inland, as well as where reclaimed land and idle fields have been misclassified in earlier studies. Because the data are available for every year at a consistent 30-meter resolution, they can be used to track the rise and fall of invasive species, evaluate the success of restoration projects, study erosion and sediment build-up, and refine estimates of blue carbon storage.
A Clearer Picture for Protecting the Coast
For non-specialists, the main takeaway is straightforward: this work turns scattered satellite images into a coherent, high-precision movie of how China’s coastal wetlands have changed over 40 years. Instead of relying on occasional snapshots or rough global summaries, scientists and planners now have a detailed, year-by-year record that shows where natural defenses are holding, where they are failing, and where interventions are working. That clearer picture can guide smarter coastal development, help prioritize restoration efforts, and strengthen nature-based strategies for climate adaptation and carbon storage along one of the world’s most heavily used coastlines.
Citation: Zhang, Z., Chi, Y., Liu, Z. et al. National coastal wetland mapping over the last four decades: An annual classification with high accuracy. Sci Data 13, 250 (2026). https://doi.org/10.1038/s41597-026-06570-3
Keywords: coastal wetlands, remote sensing, Landsat, blue carbon, China coastline