Clear Sky Science · en
A high-resolution daily CO₂ dataset for China (2016–2020)
Why tracking China’s carbon footprint matters
Carbon dioxide is the main human-made gas heating the planet, and China is now the world’s largest emitter. Yet even in this closely watched country, we have lacked a clear, day‑by‑day picture of how carbon pollution and natural carbon uptake vary across its vast territory. This article presents a new high‑resolution dataset that maps atmospheric CO₂ over China every single day from 2016 to 2020, offering a sharper lens on where carbon is coming from, where it is being absorbed, and how these patterns change with the seasons.
Gaps in watching an invisible gas
CO₂ itself is invisible, and so are many of the processes that release or absorb it. For years, scientists have relied on two main tools: scattered ground stations that measure air at fixed points, and satellites that scan the atmosphere from space. Ground stations are very accurate but sparse, missing most of the country in between. Satellites such as NASA’s OCO‑2 provide wide coverage but only see narrow strips of the Earth on each orbit and are often blinded by clouds and haze. As a result, raw satellite maps of CO₂ are full of holes in both space and time, limiting their usefulness for tracking regional emissions or testing climate policies.
Fusing many clues into one clear picture
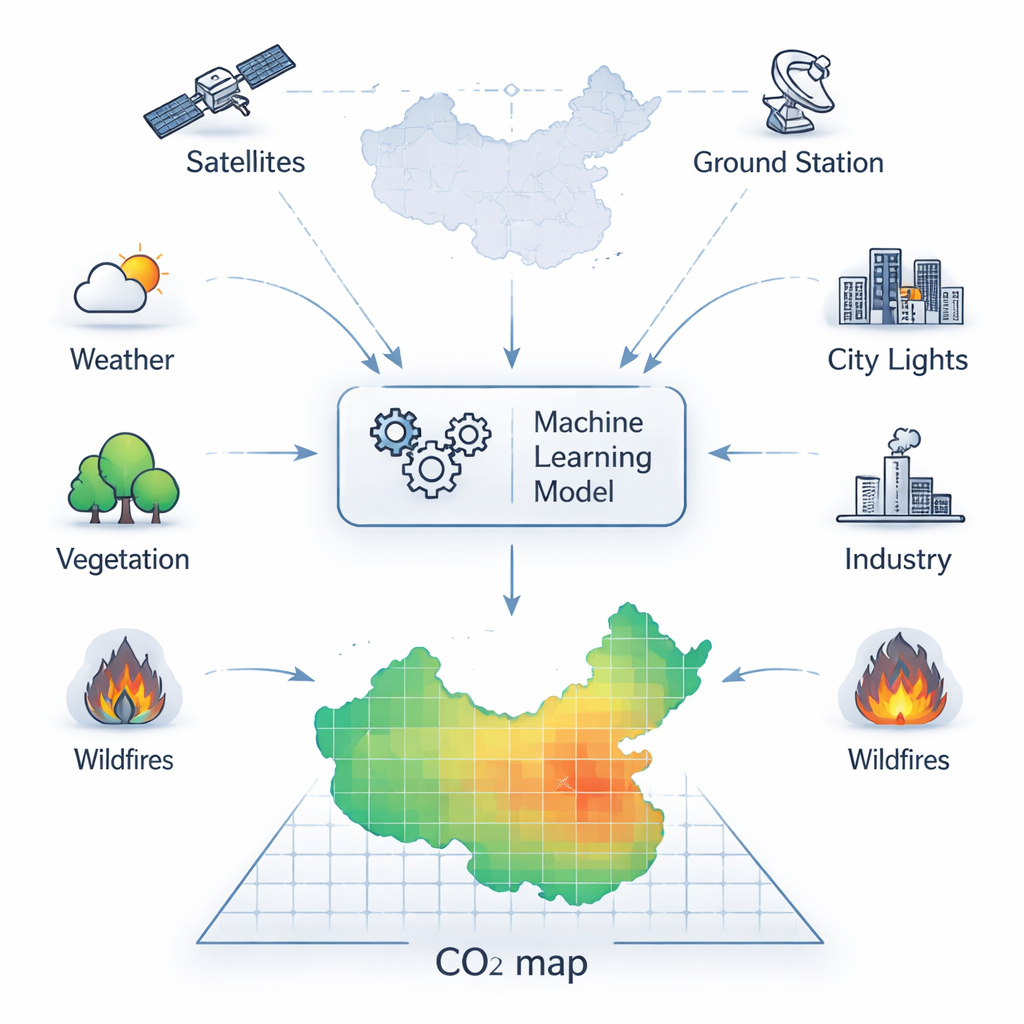
To fill in these gaps, the researchers developed a method that learns how CO₂ behaves by combining satellite readings with a wide range of other information. They started from OCO‑2’s precise, but patchy, CO₂ measurements and aligned them on a fine grid covering China at about 10‑kilometer spacing. Onto this grid they layered data on weather, temperature, humidity, sunlight, soil moisture, vegetation health, fossil‑fuel emissions, nighttime lights (a stand‑in for economic activity), and fire emissions, along with other satellite CO₂ products and global reanalysis fields. A powerful machine‑learning algorithm called XGBoost was then trained to predict CO₂ everywhere and every day from these combined clues, effectively learning how different conditions and activities imprint themselves on the air above.
Smarter training for a complex model
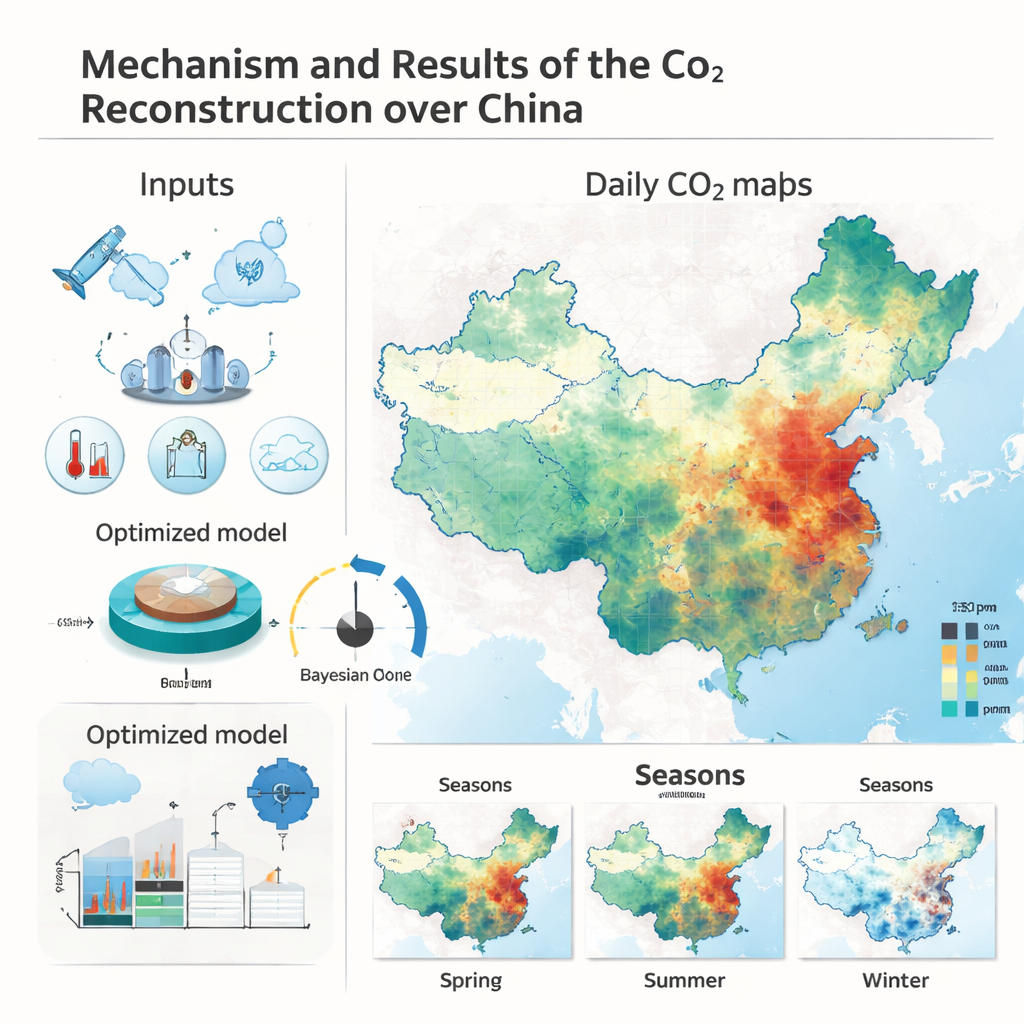
Modern machine‑learning models can capture very subtle patterns but are notoriously sensitive to their internal settings. Instead of manually tuning these settings, the team used a strategy borrowed from statistics called Bayesian optimization. This approach methodically searches for combinations of model parameters that give the best performance, guided by past trials rather than random guesswork. They also used a recent technique named SHAP, which lets them break down each model prediction into contributions from individual factors, such as fossil‑fuel emissions, vegetation, or humidity. This added transparency helps ensure the model reflects real physical behavior—for example, that greener regions tend to pull more CO₂ from the air—rather than spurious patterns hidden in the data.
What the new maps reveal
The resulting dataset delivers seamless daily maps of the column‑averaged CO₂ concentration over China between 2016 and 2020. When compared against withheld OCO‑2 observations, the reconstructed values match extremely well, explaining about 98% of the observed variation and differing on average by well under 1 part per million. Independent checks against high‑precision ground stations in Hefei and Xianghe confirm that the new product is at least as reliable as, and often better than, established global reanalysis datasets. The maps highlight a clear pattern of higher CO₂ over eastern industrial regions and densely populated city clusters, and lower values over high plateaus and major forested areas. They also capture strong seasonal swings: CO₂ rises in winter when heating and power demand increase and plant growth slows, and falls in summer when vegetation is at its peak.
How this helps climate action
For non‑specialists, the key takeaway is that we now have a much sharper and more continuous view of CO₂ over China—day by day, region by region. This dataset does not directly measure factory or city emissions, but it greatly improves our ability to see their fingerprints in the atmosphere, to separate them from natural variations, and to check whether emission‑cutting efforts are making a measurable difference. In practical terms, these high‑resolution maps can help scientists refine estimates of carbon sources and sinks, assist policymakers in tracking progress toward China’s carbon peaking and carbon‑neutrality goals, and guide industries and cities as they plan cleaner, more climate‑friendly futures.
Citation: Yuan, Z., Liu, Y., Yang, A. et al. A high-resolution daily CO₂ dataset for China (2016–2020). Sci Data 13, 249 (2026). https://doi.org/10.1038/s41597-026-06569-w
Keywords: carbon dioxide, satellite data, China emissions, machine learning, climate monitoring