Clear Sky Science · en
High-Resolution Leaf Image Sequences with Geometric Alignment for Dynamic Phenotyping of Foliar Diseases
Watching Plant Illness Unfold in Real Time
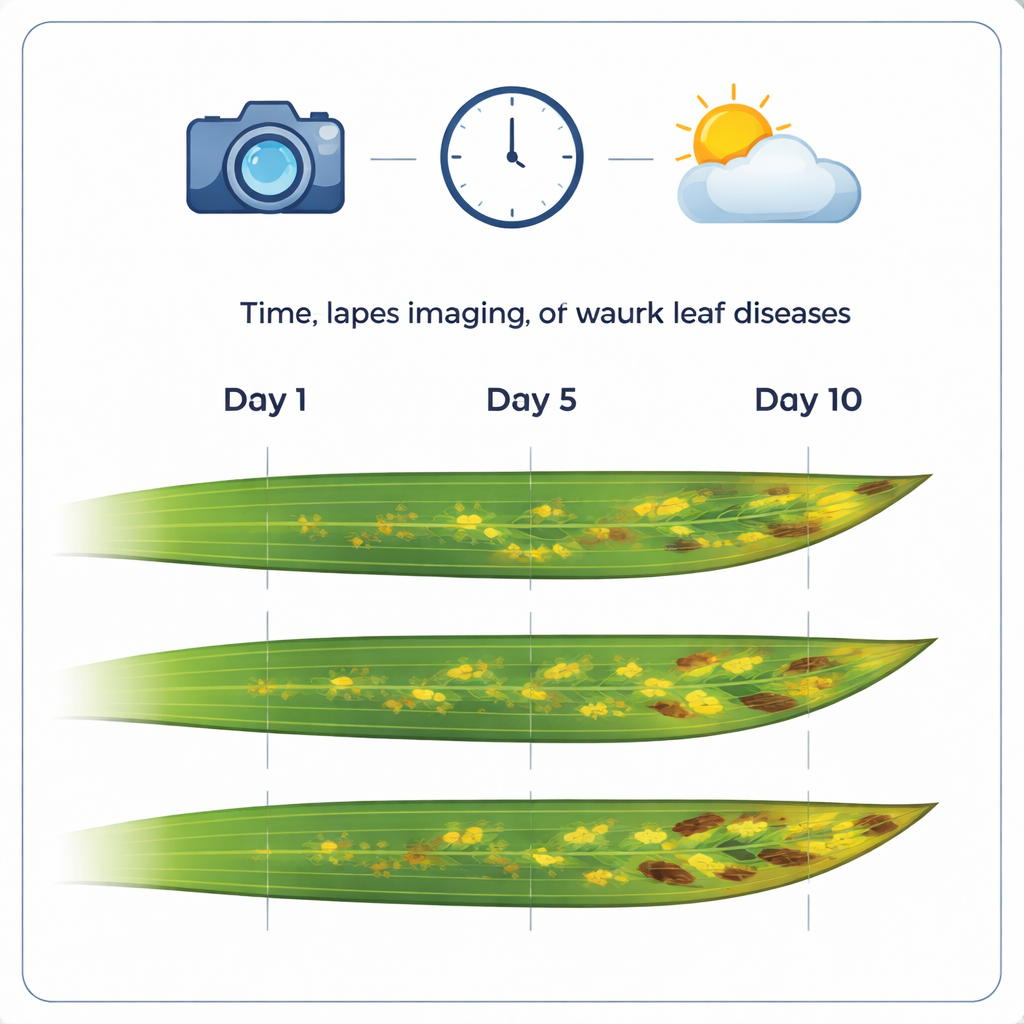
Farmers and gardeners usually notice plant diseases only after brown spots and yellow streaks have already appeared. But what if we could watch those symptoms emerge, hour by hour, and learn exactly how weather, plant variety, and different pathogens shape an outbreak? This article introduces a public dataset that does just that for wheat, one of the world’s most important food crops. By following individual leaves with a camera over days and weeks, the authors open a new window on how leaf diseases start, spread, and interact.
A New Photo Library of Sick Leaves
The core of the work is a carefully assembled collection of 12,520 high-resolution color images of wheat leaves. These pictures are grouped into 1,032 time-lapse sequences, each following the same leaf over about two weeks with near-daily photos. Many of the leaves show major wheat diseases such as brown rust, yellow rust, and Septoria tritici blotch. By keeping the image resolution very fine (about three hundredths of a millimeter per pixel), the dataset captures small details like individual lesions, rust pustules, and tiny fruiting bodies where fungi produce spores.
Keeping Every Leaf in the Same Place
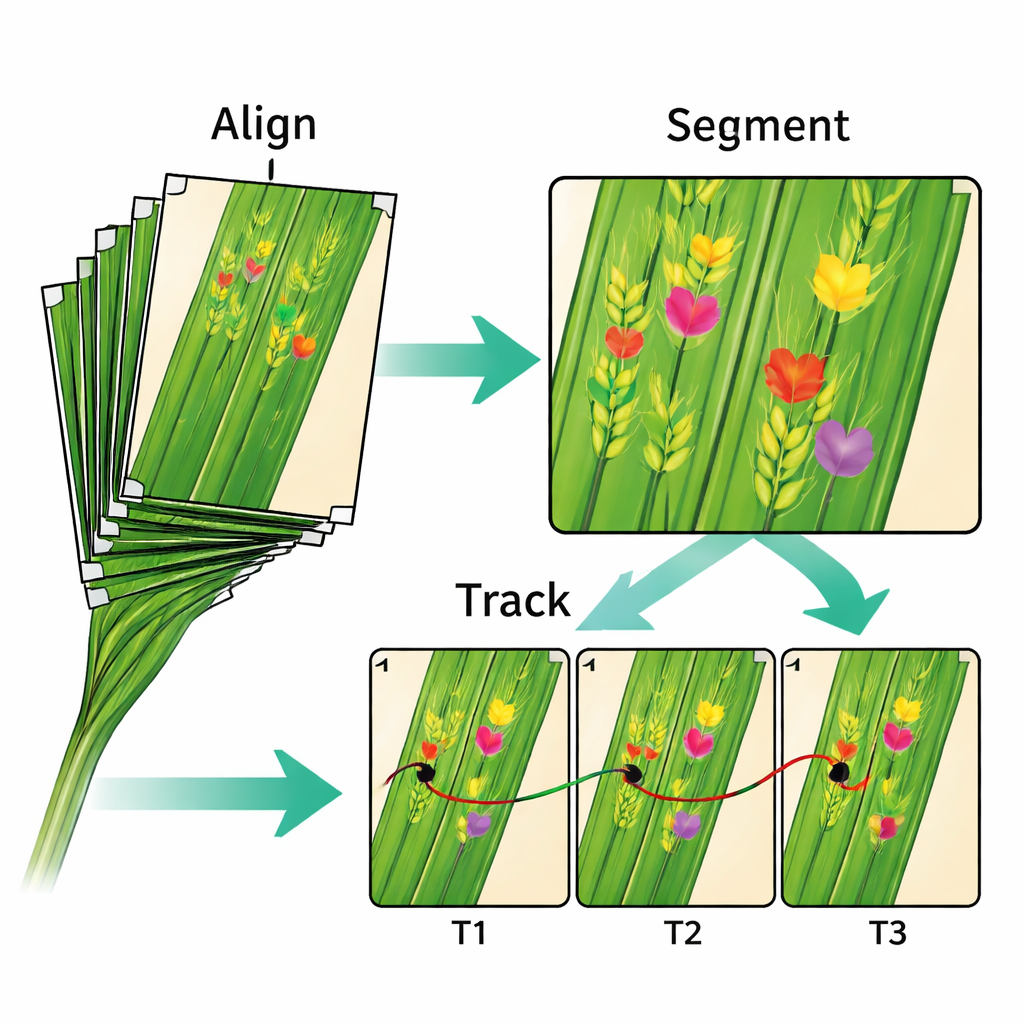
One of the biggest technical hurdles in studying such time series is that leaves move and change shape. To solve this, the researchers gently flattened each leaf against a clear plate and added small white ink marks as reference points. Computer-vision software then used these marks to line up all images in a sequence so that the same patch of tissue appears in the same location from day to day. The median alignment error is just 0.16 millimeters—good enough to track most lesions as they expand. Alongside the images, the team provides the mathematical transformations used for alignment, so others can test alternative methods or improve on the existing ones.
From Pictures to Measurable Disease
After alignment, the authors applied deep-learning models to locate and outline symptoms on each leaf. The processing pipeline detects key points, segments diseased areas, and links the same lesion across multiple days based on how much the outlined regions overlap. This makes it possible to measure how fast individual spots grow, when new pustules appear, and how many fruiting bodies develop. The dataset also includes weather records, information on fungicide and inoculation treatments, and details on 15 wheat cultivars with contrasting leaf shapes and levels of resistance. These extras allow scientists to explore how disease development depends on plant genetics, management choices, and changing field conditions.
Testing Smarter Image Tools
Beyond plant health itself, the dataset is a playground for computer scientists and engineers. The authors show how their current step-by-step approach—align first, then segment, then track—works reasonably well but still misses context and requires manual quality checks. They argue that the real opportunity lies in more integrated, "end-to-end" systems that learn alignment, symptom detection, and tracking all at once, inspired by similar advances in medical imaging. Because the data include both raw images and processed outputs such as masks and marker coordinates, researchers can benchmark new algorithms and compare them directly to the existing pipeline.
What This Means for Future Harvests
For non-specialists, the practical message is that we are learning to monitor plant diseases with the same precision and continuity used in modern medicine. By turning leaves into time-lapse stories rather than single snapshots, this dataset helps scientists pin down which types of resistance really matter in the field and under which weather patterns outbreaks accelerate or slow. Although the current data come from a single location and focus on wheat, the methods and tools can be adapted to other crops and stresses. In the long run, such detailed tracking could guide breeders toward more durable disease resistance and support early-warning systems that protect yields before damage becomes visible to the naked eye.
Citation: Anderegg, J., McDonald, B.A. High-Resolution Leaf Image Sequences with Geometric Alignment for Dynamic Phenotyping of Foliar Diseases. Sci Data 13, 247 (2026). https://doi.org/10.1038/s41597-026-06567-y
Keywords: wheat leaf diseases, time lapse imaging, plant phenotyping, digital plant pathology, crop disease resistance