Clear Sky Science · en
High-resolution microclimatic grids for the Bohemian Forest Ecosystem based on in situ measurements
Why tiny temperature differences in forests matter
When we hear about climate change, we often think of global averages or city weather reports. But animals, plants, and fungi actually experience climate at ground level and under tree canopies, where temperatures can differ by several degrees over just a few meters. This study zooms in on one of Central Europe’s largest forest wilderness areas, the Bohemian Forest Ecosystem, to map these “microclimates” in unprecedented detail. The resulting high‑resolution temperature maps can help protect wildlife, guide forest management, and improve predictions of how ecosystems will respond to a warming world. 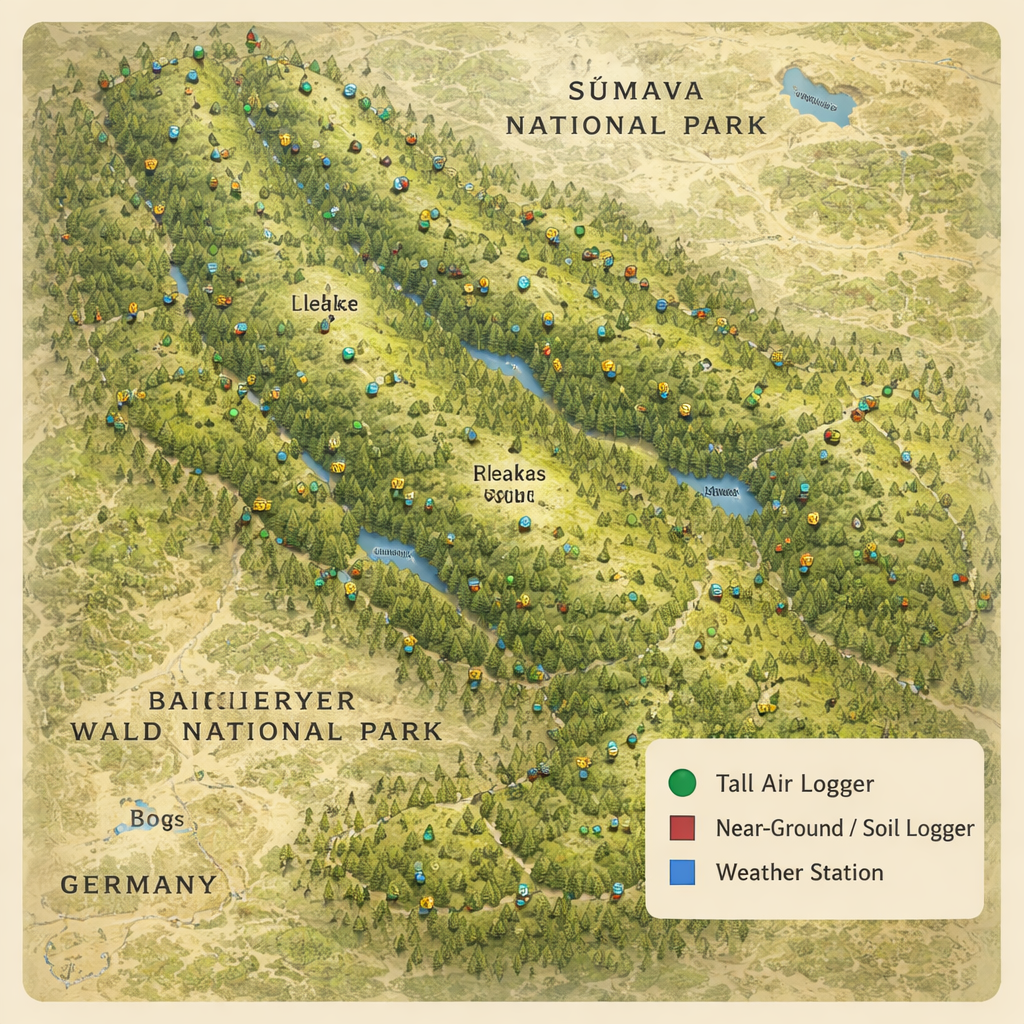
A mountain forest under the microscope
The Bohemian Forest Ecosystem stretches roughly 190 kilometers along the border of Germany and the Czech Republic, forming a high, cool ridge with steep slopes, deep valleys, glacial lakes, and extensive bogs. Above about 1100 meters, Norway spruce dominates, while lower elevations were once mixed beech–fir–spruce forests but are now largely spruce plantations. This region includes two national parks and is one of the largest forest wilderness areas in Central Europe, making it an ideal living laboratory for understanding how terrain and trees shape local temperatures under climate change.
Building a dense forest thermometer network
To capture temperature as organisms actually feel it, the researchers installed a permanent network of 270 microclimate stations across both national parks. They chose sites systematically so that all major combinations of elevation, sunlight exposure, moisture, and canopy cover were represented, from dense old-growth stands to recently disturbed, treeless patches. At each site, they recorded air temperature two meters above the ground all year long. At 168 sites, they also measured temperatures just 15 centimeters above the ground and 8 centimeters below the soil surface using robust, shielded loggers that took readings every 15 minutes for a full year. Careful calibration ensured that tiny sensor biases—on the order of a few tenths of a degree—did not distort the results. 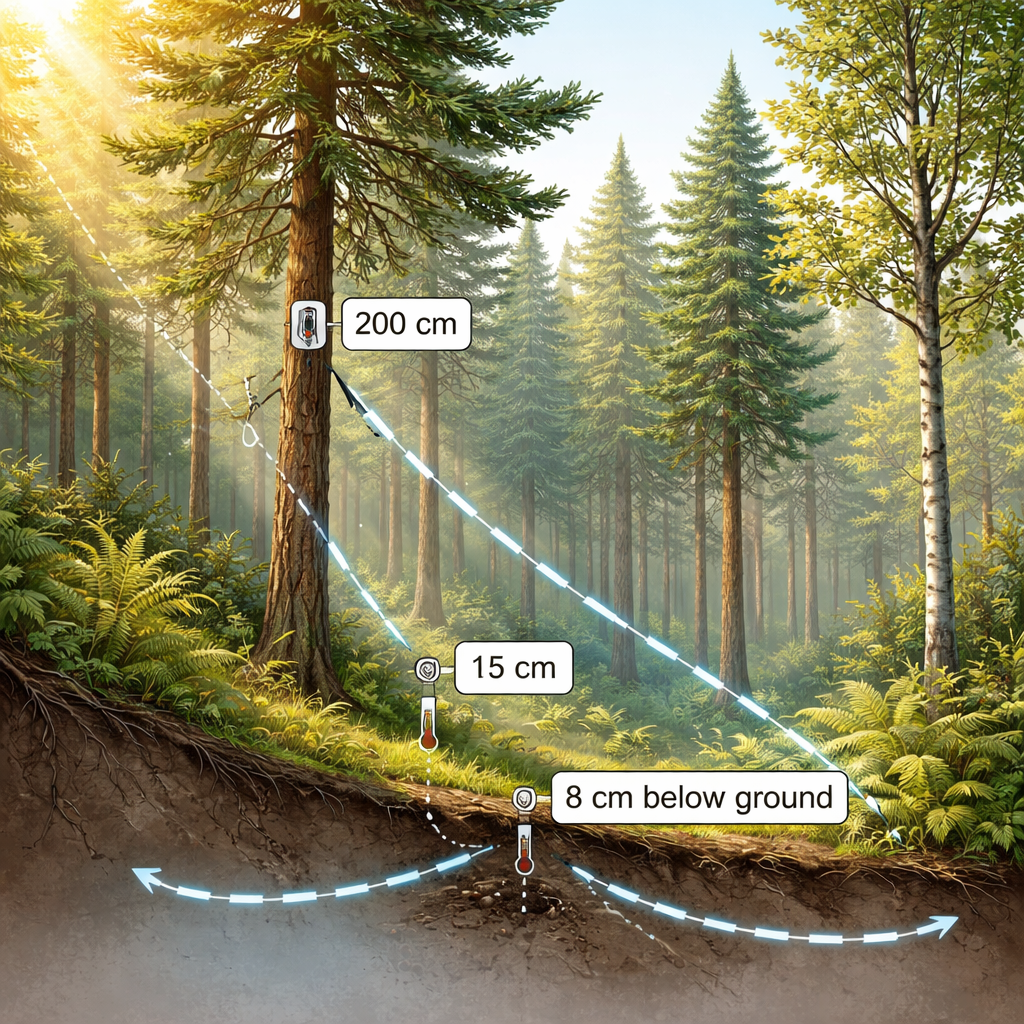
From laser‑scanned forests to ultra‑fine climate maps
Collecting measurements is only half the job; turning them into continuous maps requires understanding why temperatures vary from place to place. The team used detailed laser (LiDAR) scans of the landscape to describe both the shape of the land and the three‑dimensional structure of the forest. From these data, they derived elevation, slope, cold‑air pooling tendencies, wetness of the soil, and how much and what kind of canopy (conifer vs. deciduous) covers each 5‑meter grid cell. They then used advanced statistical models that can learn smooth, often curved relationships between these factors and the measured temperatures. Elevation and exposure to sun were key drivers across all models, but at least one canopy‑related feature was always important, especially for extreme highs and lows. The models were rigorously tested using spatial cross‑validation, where whole chunks of the region were left out during training and then used to check prediction accuracy.
Sharper pictures than global climate products
To see whether their local maps really added value, the authors compared them with leading global and European climate datasets. Against SoilTemp (for soil), ForestTemp (for near‑ground air), and ERA5‑Land (a state‑of‑the‑art global weather reanalysis), the Bohemian Forest grids consistently matched on‑the‑ground measurements more closely. Typical prediction errors for annual mean temperatures were less than half a degree Celsius, and even for extremes they stayed within about one to two degrees. The new maps also revealed much finer‑scale patterns than coarse global products, especially in steep valleys, disturbed forests, and high‑elevation sites where cold air pools or tree cover has recently changed. In many of these places, the global datasets either smoothed out the variation or misestimated average conditions by several degrees.
What these maps unlock for nature and people
For non‑specialists, the central message is that where you stand in a forest—on a ridge, in a valley, under dense canopy, or in a recent clearing—can change the temperature you experience as much as moving hundreds of kilometers on a traditional climate map. By combining an intensive sensor network with detailed 3D mapping, this study provides 5‑meter‑resolution temperature grids that better reflect the real living conditions of species in the Bohemian Forest. These maps can help identify cool refuges for sensitive plants and animals, guide where to restore or thin forests to protect biodiversity and tree regeneration, and improve forecasts of how species ranges may shift as the climate warms. Although based on a single year, the patterns are highly consistent between years, and the authors show how their approach can be updated over time, offering a powerful new lens on how forests buffer climate for life beneath their canopies.
Citation: Brůna, J., Macek, M., Man, M. et al. High-resolution microclimatic grids for the Bohemian Forest Ecosystem based on in situ measurements. Sci Data 13, 246 (2026). https://doi.org/10.1038/s41597-026-06566-z
Keywords: forest microclimate, Bohemian Forest, high-resolution climate maps, biodiversity conservation, LiDAR