Clear Sky Science · en
Community-based nearshore wave and water level monitoring in Nunavut, Arctic Canada 2021–2023
Why Arctic Waves Matter to Everyday Life
The shores of the Canadian Arctic may seem far away, but the changes happening there are a preview of what many coasts around the world could face. As sea ice thins and retreats, ocean waves can grow larger and reach farther inland, affecting homes, roads, and traditional travel routes. This study describes a new, community-led effort to closely track waves and water levels along Nunavut’s coastline, providing rare on-the-ground measurements that can help Arctic communities plan for climate change and protect the places where people live, travel, and hunt.
Changing Coasts in a Warming North
The Canadian Arctic Archipelago is a maze of islands and narrow waterways that form much of Nunavut’s coastline, within Inuit Nunangat, the Inuit homeland. These shores are shaped by sea ice, glaciers, permafrost, and strong tides. Climate projections suggest that Arctic waves will steadily grow in the coming decades as sea ice disappears, a trend that matches Inuit knowledge of rougher seas and less predictable ice. Larger waves can speed up coastal erosion, worsen flooding, and threaten trails used for hunting and fishing. Yet, despite these risks, there have been very few direct measurements of waves and water levels in the nearshore zone—the shallow waters right next to the coast where people travel and infrastructure sits.
Community Partnerships on the Water
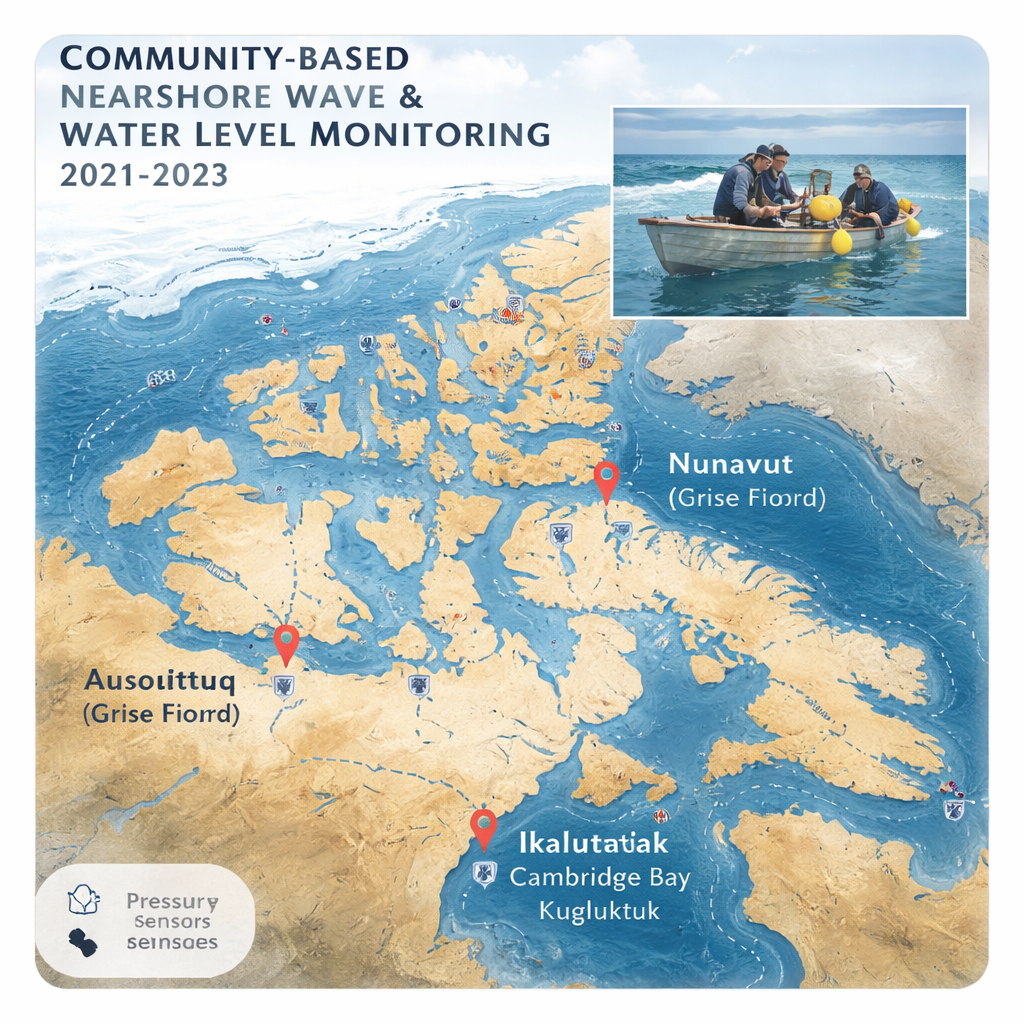
To fill this gap, the research team worked closely with three Nunavut communities—Ausuittuq (Jones Sound), Ikaluktutiak, and Kugluktuk (both in Coronation Gulf). Local Hunters and Trappers Organizations helped choose monitoring sites that matter most to residents, including erosion hotspots, low-lying beaches, and rocky shores. Together, they installed 19 small pressure sensors on the seabed in shallow water and deployed six floating wave buoys farther offshore, using local boats and knowledge of safe routes and ice conditions. This approach ensured that the measurements reflect real community priorities and that local partners gained experience and capacity to lead future coastal studies.
How the Arctic Waves Were Measured
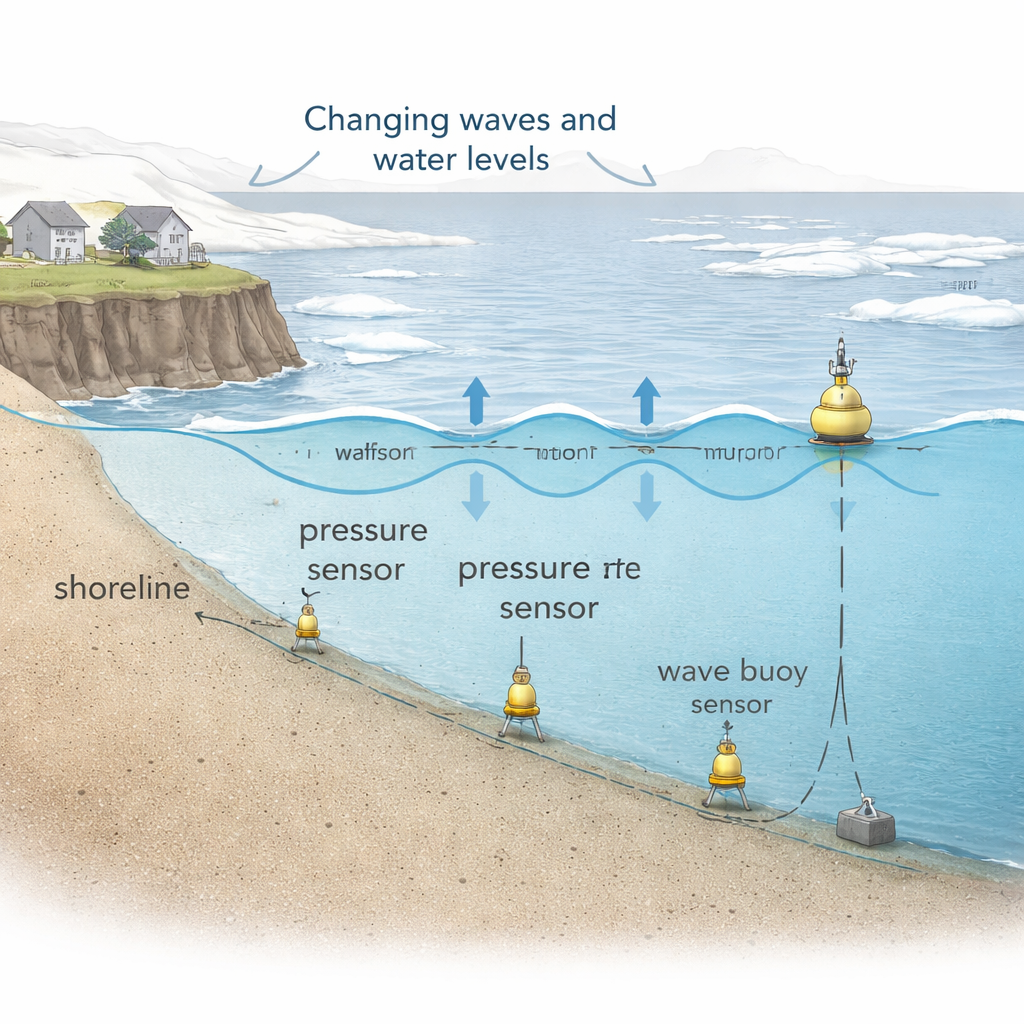
The instruments recorded how water pressure and surface motion changed over time, allowing scientists to calculate water levels and wave statistics such as wave height and period (the time between wave crests). Between 2021 and 2023, the team collected over 427 days of hourly observations, covering 398 unique days across the three communities. Nearshore pressure sensors captured both the regular rise and fall of the tides and the extra “setup” of water level caused by breaking waves pushing water toward shore. Offshore GPS wave buoys tracked waves before they felt the bottom, including their height, period, and direction. By comparing these synchronized records, the researchers could see how waves generated in deeper water transformed as they approached the coast.
Working Around Ice and Harsh Conditions
Gathering reliable data in the Arctic proved challenging. Sea ice and drifting icebergs could scrape along the seabed, damage instruments, or drag moored buoys away. In some cases, buoys were lost under drifting ice or became frozen into surface ice. On rocky coasts, sensors had to be drilled into solid rock or attached to custom brackets to survive the ice. On sandy shores, they were anchored with screw posts. Field teams used precise GPS surveying to map sensor positions and local beach profiles, and they carefully filtered out readings taken when sensors were exposed at very low tide. The team also checked their homemade low-cost sensors against factory-calibrated instruments, finding excellent agreement and demonstrating that affordable tools can still produce high-quality data in remote environments.
Building a Baseline for Future Change
The result of this work is a detailed, openly available dataset describing waves and water levels along three very different Arctic coasts, including wave heights up to about 1.7 meters and peak periods up to 6 seconds. All records are shared in simple formats with clear documentation so that Inuit organizations, local planners, engineers, and scientists can reuse them. For communities, these measurements provide a much-needed baseline for understanding how quickly coasts are changing, how storms might affect travel routes or infrastructure, and where protective measures may be needed most. For the wider world, this project shows how combining local knowledge with modern instruments can reveal the fine-scale workings of a rapidly warming Arctic shoreline.
Citation: Didier, D., Zouaghi, F., Coulombe, S. et al. Community-based nearshore wave and water level monitoring in Nunavut, Arctic Canada 2021–2023. Sci Data 13, 239 (2026). https://doi.org/10.1038/s41597-026-06559-y
Keywords: Arctic waves, Nunavut coasts, sea ice change, coastal erosion, community monitoring