Clear Sky Science · en
Harmonized food consumption dataset by food category and acquisition source for Sub-Saharan African countries
Why what we eat is hard to measure
How much do families actually spend on food, and where does that food come from—markets, their own farms, or gifts from others? These questions matter for tackling poverty, hunger, and climate change, yet, until now, they have been surprisingly hard to answer across African countries. This article describes a new, public dataset that pulls together detailed information on what households eat in 16 sub-Saharan African countries, cleans and standardizes the numbers, and turns them into a powerful tool for researchers, governments, and citizens.
Bringing scattered surveys under one roof
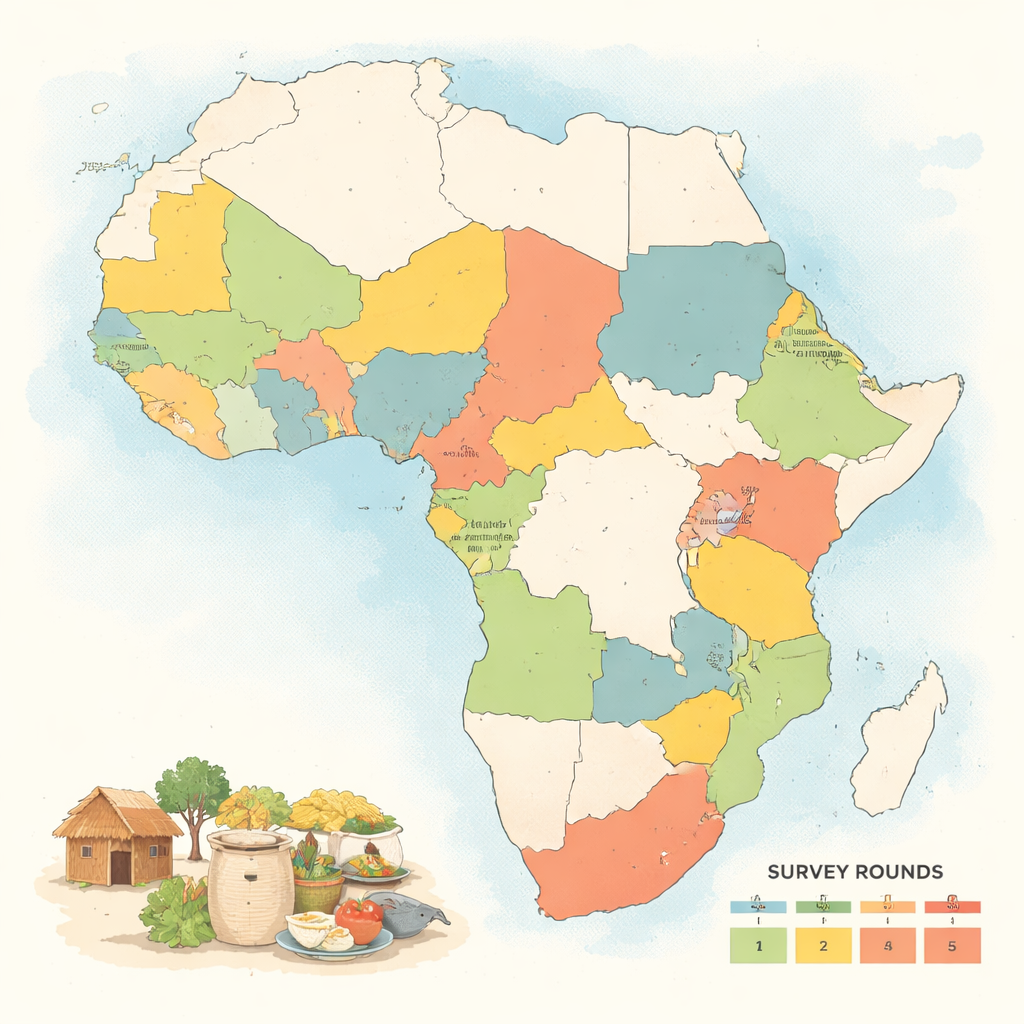
Many African countries regularly survey households about their living conditions, including what foods they consume. But each survey is designed slightly differently: one might ask about the past week, another about the past month; one lists dozens of specific foods, another bundles them into just a few groups; some track whether food was bought, grown at home, or received as a gift, while others do not. This patchwork has made it difficult to compare food consumption between countries or over time. The authors assembled 36 large, nationally representative surveys collected between 2008 and 2021 in 16 countries that together account for more than half of sub-Saharan Africa’s population and economic output, then set out to make them speak the same language.
Turning local measures into comparable numbers
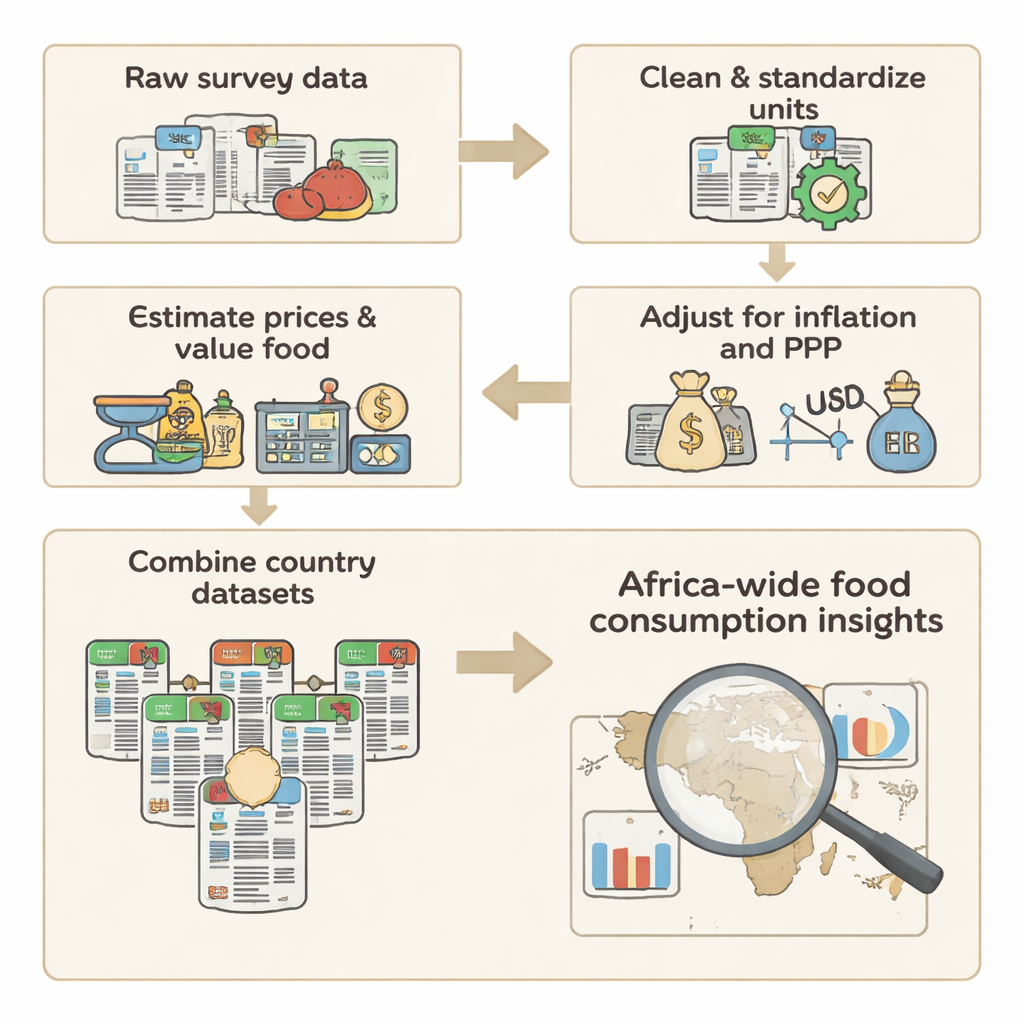
A major challenge is that families do not report food in neat, standard units. Instead, they talk about heaps of vegetables, mudu of grain, bundles of leaves, or specific local dishes like Ghana’s kenkey or banku. The research team used conversion tables gathered by national statistics offices to translate these local measures into kilograms and liters wherever possible, and harmonized similar food names into common categories. When conversion factors were missing, they carefully filled gaps using typical values observed nearby, so that all households’ answers could be compared on equal terms.
Putting a value on homegrown and gifted food
While most surveys record how much households pay for purchased food, they often leave out the monetary value of food grown at home or received as gifts, even though this can be a large share of what families eat—especially in rural areas. To fix this, the team first calculated typical prices for each food item by dividing reported spending by the quantity purchased, then used these prices to estimate what homegrown and gifted foods would be worth if they were sold. They repeated this process at increasingly broad geographic levels—village, district, region, country—to avoid relying on just a handful of observations. Afterward, they converted everything into yearly totals, adjusted for inflation, and expressed values in a common international unit based on 2017 purchasing power, so that, for example, a dollar of food in Nigeria and a dollar of food in Kenya represent similar buying power.
From raw numbers to big-picture insights
Once all survey waves were cleaned and converted, the authors stacked them into a single dataset that records, for each household, how much value of food it consumes from purchases, its own production, and gifts, broken down by food groups such as cereals, vegetables, dairy, and meat. The data also include basic household characteristics like size, age and gender of the household head, urban or rural location, and administrative region. Early analyses show that across the 16 countries, about three quarters of food value tends to come from market purchases, around one fifth from home production, and the rest from gifts, with notable differences between regions. Cereals dominate food spending in both Ethiopia and Nigeria, for instance, but Ethiopian households rely much more on their own milk than Nigerians do.
Checking the numbers and opening them to the world
To build confidence in the dataset, the team ran multiple checks. They searched for inconsistent or extreme values and gently capped the very highest 1% of food spending figures so that a few unusual cases would not distort averages. They compared average food consumption per person with each country’s income per person from World Bank data and found a clear positive relationship: richer countries tend to have higher food consumption values. They also contrasted their figures with global databases that track food quantities and spending and found broadly similar rankings across countries, even if the exact numbers differ. All data files and the computer code used to build them are publicly available, along with an online dashboard that lets users explore patterns without writing a single line of code.
What this means for everyday life
For a lay reader, the key message is that we now have a much clearer, comparable picture of how millions of African households feed themselves, how much they depend on markets versus their own farms, and how diets are changing. This kind of evidence can inform policies on nutrition, social protection, agricultural support, and climate resilience—helping governments and organizations target assistance where it is most needed and track whether living standards are improving over time. By turning messy, country-specific surveys into a harmonized, open dataset, the study lays a foundation for more informed debates and better decisions about food and well-being across sub-Saharan Africa.
Citation: Nnaji, A.P., Alia, D.Y., Raina, A. et al. Harmonized food consumption dataset by food category and acquisition source for Sub-Saharan African countries. Sci Data 13, 232 (2026). https://doi.org/10.1038/s41597-026-06548-1
Keywords: food consumption, household surveys, sub-Saharan Africa, nutrition data, poverty and well-being