Clear Sky Science · en
A spatially rich, temporally coherent soil spectral dataset for soil organic carbon estimation
Why the carbon beneath our feet matters
Carbon is not only in the air we breathe—it is also stored in the soils under our cities, farms, and forests. This hidden storehouse, called soil organic carbon, helps control climate change, supports crops, and keeps ecosystems healthy. Yet it is surprisingly hard and expensive to measure in detail across large areas. This study introduces a new, richly detailed soil dataset from around Seoul, South Korea, that uses light-based measurements to estimate how much carbon is stored in the top layer of soil. The work shows how we can track this vital resource more quickly and cheaply, which is crucial as land use and climate keep changing.
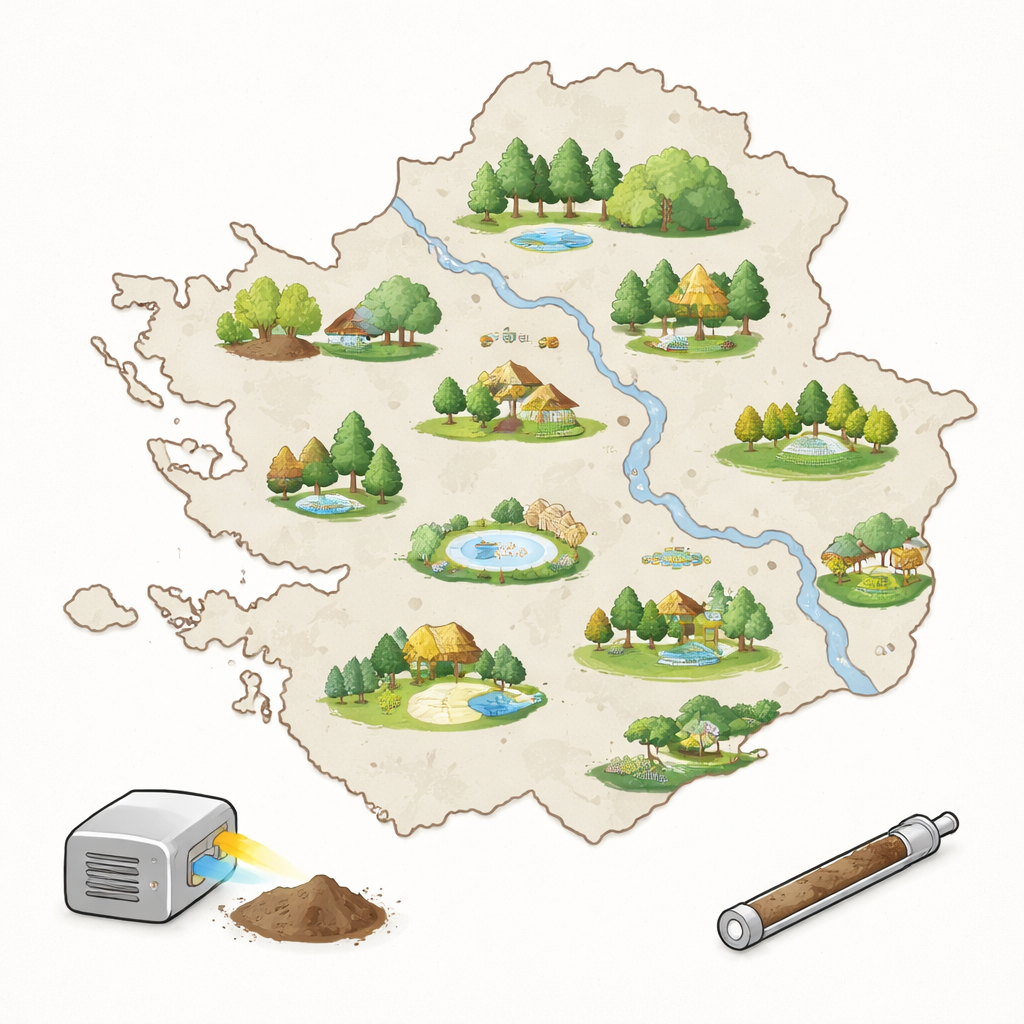
A living patchwork around a megacity
The researchers focused on Gyeonggi Province, a 10,200-square-kilometer region encircling Seoul that has undergone rapid urban growth. This landscape is a complex patchwork: dense forests lie next to paddy fields, orchards, greenhouses, urban parks, riverside zones, and bare construction or exposed soils. To capture this diversity, the team collected soil from 1,500 locations in 2024, all within a single growing season to keep the timing consistent. They deliberately sampled 11 major land cover types—from deciduous, coniferous, and mixed forests to artificial grasslands and bare land—across a wide range of elevations and settings, avoiding paved and artificial surfaces. The result is a spatially rich snapshot of how soil conditions vary across one of Asia’s most dynamic metropolitan regions.
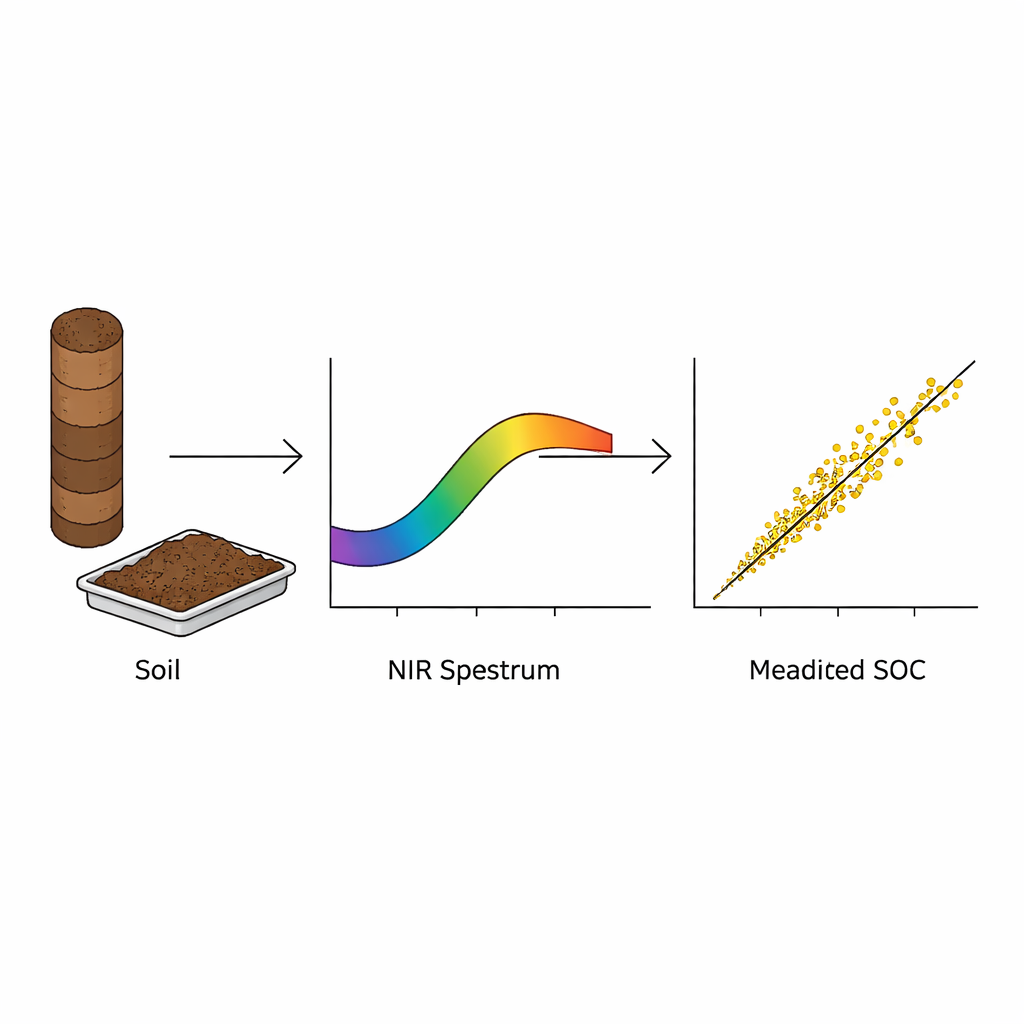
Using invisible light to read soils
Instead of relying only on slow, traditional lab tests, the study turned to near-infrared (NIR) spectroscopy, a technique that shines invisible light on soil and measures how it is reflected. Each soil sample was dried, sieved, and carefully prepared, then scanned by a bench-top NIR device over wavelengths from 1,400 to 2,500 nanometers. For each of the 1,500 samples, the device recorded a smooth curve that serves as a kind of optical fingerprint of the soil. To reduce noise and emphasize key features, the researchers applied a standard mathematical filtering step before building their models. This consistent, carefully controlled process produced a large, uniform library of soil spectra that can be used by other scientists and practitioners without additional pre-processing.
Turning spectra into carbon estimates
To link these light-based fingerprints to actual carbon content, the team performed detailed chemical measurements of soil organic carbon on a subset of 712 samples—at least 40 percent of the samples in every land cover type. For each of these, they measured total carbon, removed inorganic forms with acid treatment, and interpreted the remaining carbon as organic. They then trained a statistical model known as partial least squares regression, which is well suited to handling thousands of closely spaced wavelengths. After testing the model with cross-validation and with an independent 70:30 train–test split, they found that predicted and measured carbon levels matched very closely: the model could explain about 95–96 percent of the variation, with errors of only a few tenths of a percent. This level of accuracy shows that NIR spectra can reliably stand in for more costly lab tests in this region.
A new toolbox for mapping carbon in complex landscapes
The full dataset is released as an easy-to-use file combining location, land cover, and time of sampling with both raw and smoothed NIR spectra, plus measured carbon where available. Because the sampling is dense, spans many land types, and was done within one season, it provides an unusually clean baseline for future monitoring. The authors also describe rigorous quality checks on both the carbon measurements and the NIR instrument, helping ensure that others can trust and build upon their work. Beyond carbon prediction, the library can support digital soil mapping, calibrate satellite-based estimates, and allow comparisons with soil libraries from other countries.
What this means for climate and land managers
For non-specialists, the key message is that we now have a faster, cheaper way to "read" the carbon content of soils across a complicated, rapidly changing region. By combining a large, well-designed field survey with light-based measurements and open data, this study offers a blueprint for other provinces and countries that want to track soil carbon at high resolution. In practical terms, it means planners and farmers can eventually get better maps of where soils are storing carbon well and where they are losing it, helping guide efforts to protect climate, improve soil health, and manage land more wisely.
Citation: Bae, J., Seo, I., Hyun, J. et al. A spatially rich, temporally coherent soil spectral dataset for soil organic carbon estimation. Sci Data 13, 230 (2026). https://doi.org/10.1038/s41597-026-06546-3
Keywords: soil organic carbon, near-infrared spectroscopy, soil mapping, climate mitigation, land use change