Clear Sky Science · en
An electronic product carbon footprint dataset for question answering
Why the carbon cost of your gadgets matters
Every laptop, tablet, or desktop computer you use has a hidden climate price tag. Long before you press the power button, energy and materials have already been spent mining metals, making chips, and assembling devices. Companies now publish reports that estimate these “embodied” carbon emissions, but they are scattered across thousands of hard‑to‑read PDF files. This paper introduces a new dataset that turns those messy reports into searchable, comparable information, making it easier for researchers, policy makers, and eventually consumers to understand and reduce the climate impact of everyday electronics.
Turning scattered reports into usable data
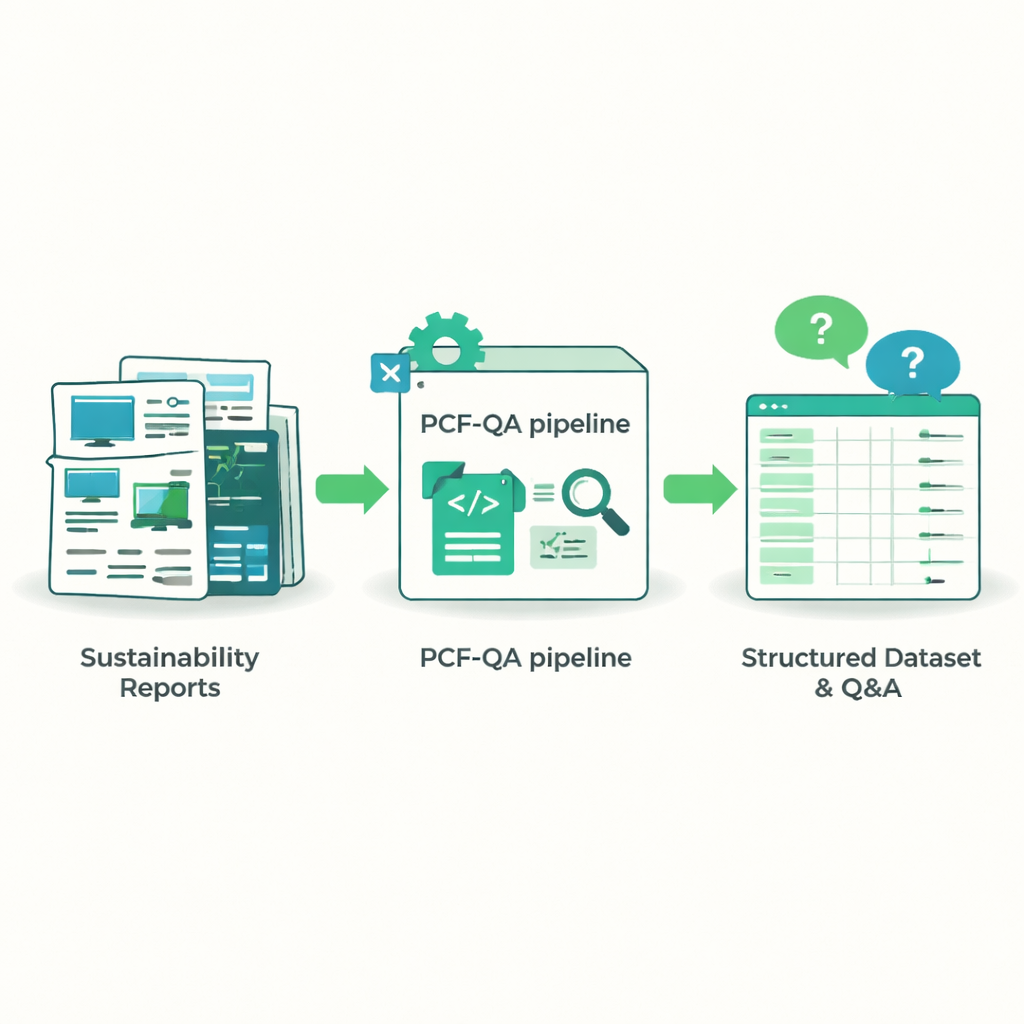
Major computer makers such as HP, Dell, Lenovo, and Acer publish product carbon footprint reports that describe how much greenhouse gas is released over a device’s life, and how much comes from different parts like the screen, battery, or circuit boards. Unfortunately, every company formats these documents differently: numbers may appear in text, tables, or charts, and key figures are often split across multiple pages. The authors collect 1,735 such reports for a wide range of products, then convert the PDFs into raw text. Using custom code and pattern‑matching rules, they pull out central facts such as total carbon footprint, how much is due to manufacturing, and the percentage contribution of each major component.
Teaching computers to answer carbon questions
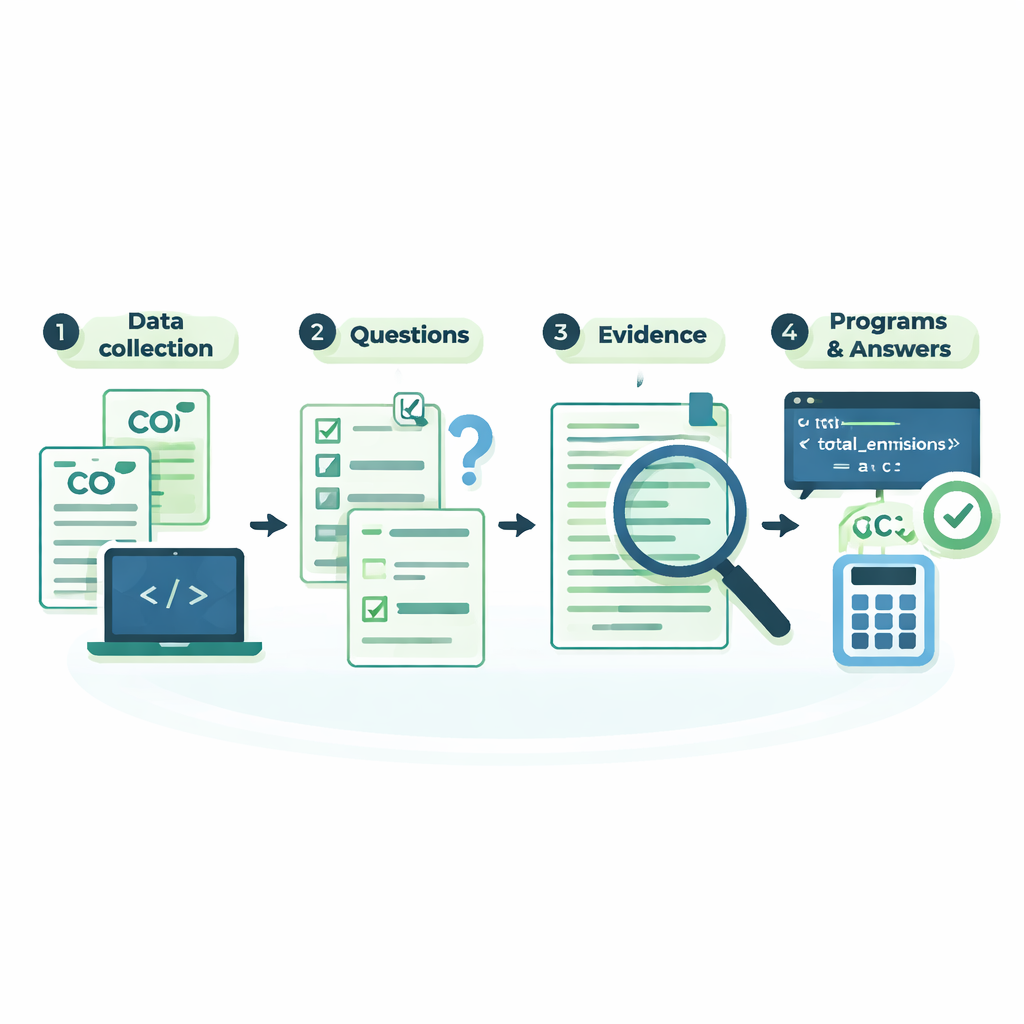
Simply listing numbers is not enough; the goal is for computer programs to answer practical questions about emissions. To do this, the team builds a “question‑answering” dataset called PCF‑QA. For each product, they create natural‑language questions like “Which component has the highest manufacturing footprint?” or “What is the carbon footprint of the display in this laptop?” and pair them with correct answers derived from the cleaned data. The questions fall into four families: word‑match (pulling a number directly from the text), max/min (finding the largest or smallest contributor), top‑k (listing the top three or five components), and calculation (computing, for example, the footprint of a part from percentages and totals). This structure lets modern language models practice both reading comprehension and basic numerical reasoning.
How the new dataset is built and checked
Behind the scenes, the authors design a careful workflow so that the extracted information can be trusted. After downloading the PDFs and parsing them to text, they use regular expressions—precise search patterns—to locate component names, percentages, and total footprints, even when they are hidden inside charts. Suspicious records, such as products whose numbers do not add up or lie far outside the typical range for a company, are flagged and manually checked against the original files. For every question, the dataset also records the exact character positions of the supporting text in the report, along with a short computer program that re‑computes the answer step by step. Running these tiny programs and comparing their outputs with stored answers provides an extra layer of validation.
What the numbers reveal about devices
Because the dataset tracks many different brands and product types, it offers a first broad look at how the carbon cost of electronics is distributed. Heavier‑duty machines such as workstations, desktops, and servers generally have much higher footprints than tablets, which are smaller and contain fewer parts. Within a single device, some components consistently dominate: displays, main circuit boards, and power supplies are usually responsible for the largest slices of manufacturing emissions, while packaging and batteries contribute relatively little. The dataset also notes which carbon accounting method each company uses, highlighting that most products rely on a single, partly opaque model whose assumptions may be outdated—an important caveat when comparing numbers across brands.
What this means for future climate‑smart tech
For non‑experts, the key message is that the climate impact of electronics can now be studied in a more systematic way. By transforming unstructured carbon reports into a standardized, question‑answering resource, this work lays the groundwork for tools that can automatically compare products, pinpoint the dirtiest components, and explore “what‑if” scenarios for greener designs. As manufacturers expand their reporting to include other environmental harms, similar methods could help society see, in concrete terms, how design choices for our phones and computers translate into pressure on the planet—and where the biggest opportunities for improvement lie.
Citation: Zhao, K., Koyatan Chathoth, A., Balaji, B. et al. An electronic product carbon footprint dataset for question answering. Sci Data 13, 228 (2026). https://doi.org/10.1038/s41597-026-06544-5
Keywords: carbon footprint, electronics, sustainability data, life cycle assessment, question answering