Clear Sky Science · en
Interpretable inflammation landscape of circulating immune cells
Why inflammation in the blood matters to you
Inflammation lies at the heart of many illnesses, from arthritis and asthma to COVID-19 and cancer. Yet doctors still struggle to read the body’s inflammatory signals in a way that clearly explains what is going wrong and which treatment will work best. This study builds a huge “map” of immune cells circulating in the blood and shows how these cells could act as living, easily sampled biomarkers to classify a wide range of inflammatory diseases.
Building a giant map of immune cells
To chart this landscape, the researchers analyzed more than 6.5 million immune cells taken from the blood of 1,047 people. These volunteers spanned 19 conditions, including autoimmune diseases such as lupus and rheumatoid arthritis, chronic lung diseases like asthma and COPD, infections such as COVID-19 and HIV, and several cancers, alongside healthy donors. Using single-cell RNA sequencing, they measured which genes were switched on in each individual cell, then used advanced statistical methods to correct for technical differences between studies and to group cells into 64 distinct immune cell states. This “Inflammation Atlas” captures both familiar players—such as T cells, B cells and monocytes—and more specialized subtypes that shift with disease.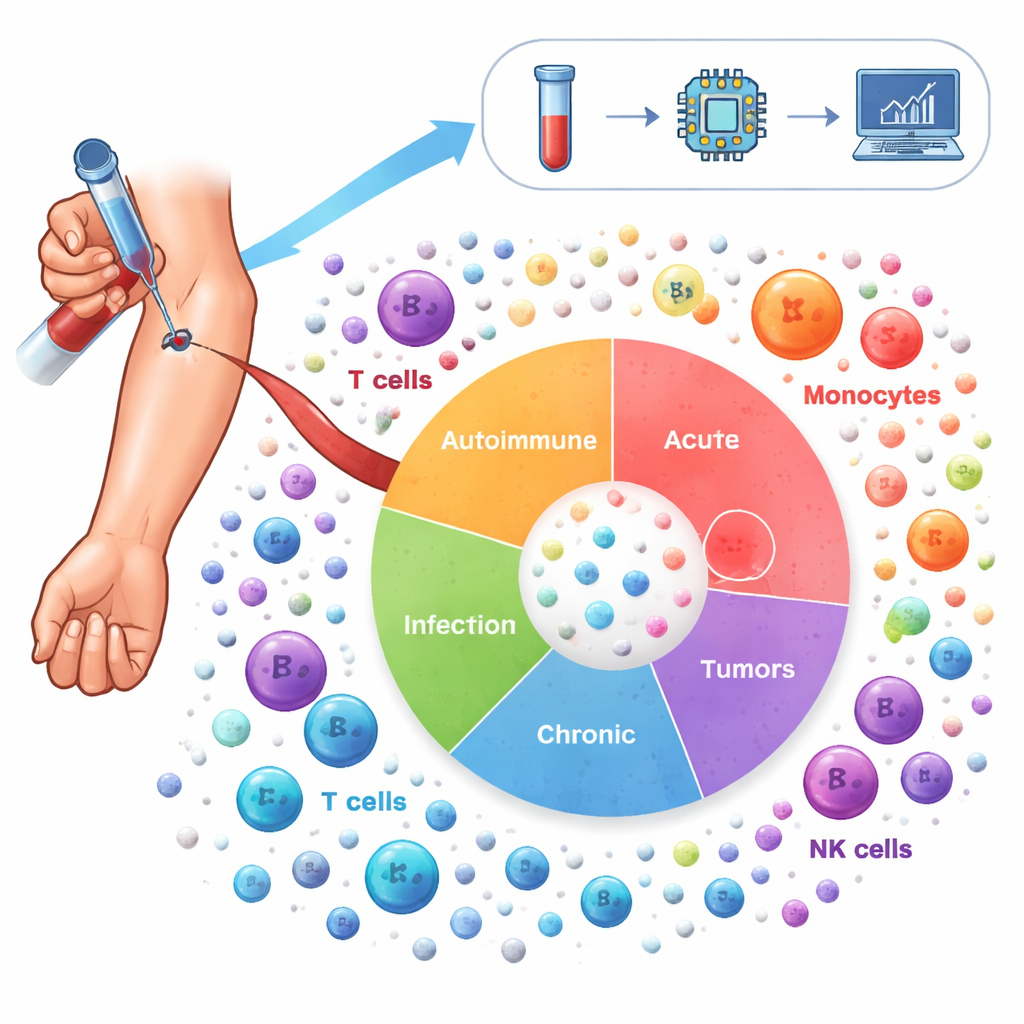
Reading the body’s inflammatory signatures
The team next focused on genes that control how immune cells become activated, move through the body, present antigens and respond to signaling molecules like interferons and tumor necrosis factor. They grouped these genes into 21 biological “signatures” and refined them for each major cell type. By comparing patients to healthy donors, they could see which signatures were turned up or down in different diseases. For example, many immune-mediated inflammatory diseases showed stronger activity of adhesion molecules and antigen-presenting machinery, while interferon responses were depressed in most cell types but heightened in certain CD8 T cells. Viral infections such as flu and COVID-19 boosted interferon-induced programs, whereas chronic infections like HIV and hepatitis B weakened them.
Zooming in on key genes and control switches
Because broad signatures still hide important details, the researchers drilled down to individual genes and their regulators. In non‑naive CD8 T cells, they found that two genes, FGFBP2 and GZMB, were especially active in specific effector memory subtypes, particularly in ulcerative colitis. These genes have been linked to damage at epithelial surfaces, and their strong signal in blood suggests these aggressive cells are already primed before they enter tissues. A separate analysis of gene regulatory networks highlighted two transcription factors, STAT1 and SP1, as central controllers of interferon-induced programs. Their activity patterns differed between diseases and cell types—for instance, opposing behavior in monocytes versus CD8 T cells in lupus, and shifts between flare and non‑flare phases—hinting at how the same pathways can be protective in one context and harmful in another.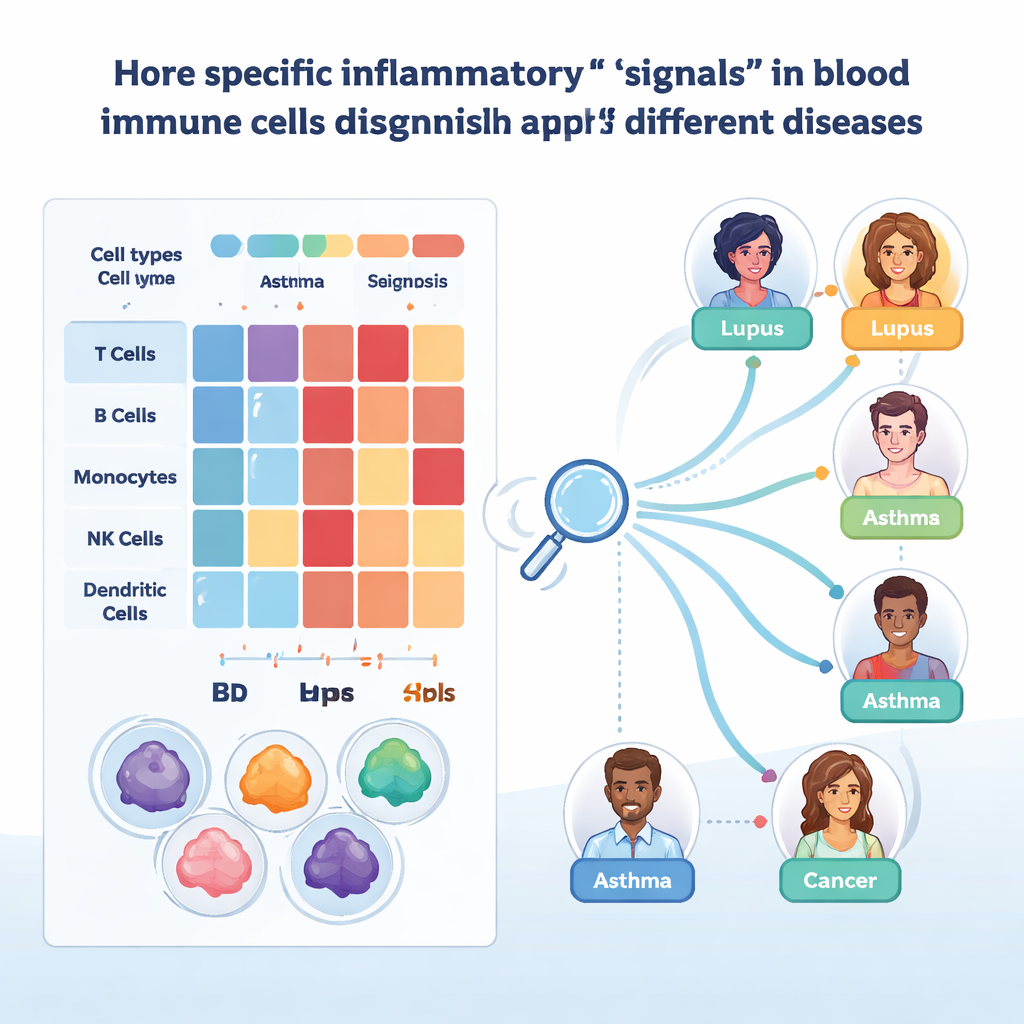
Training machines to spot disease from blood cells
To turn this atlas into a practical tool, the team applied interpretable machine learning. They trained gradient-boosted decision tree models separately for each major cell type, asking the algorithms to label individual cells with the correct disease based on their gene expression. These models reached high accuracy when tested on held-out samples, especially after correcting for technical differences. By using SHAP, a method that explains which genes drive each decision, the researchers could identify candidate biomarkers. One example is CYBA in monocytes, whose levels helped distinguish skin diseases such as psoriasis from gut inflammation in Crohn’s disease and ulcerative colitis. Another is IFITM1 in certain T cells and innate lymphoid cells, separating asthma from COPD and suggesting different patterns of chronic antiviral defense.
Toward a blood-based diagnostic compass
Finally, the authors asked whether entire patients—not just individual cells—could be classified from their circulating immune profiles. They projected each cell’s data into a compressed “embedding” space, averaged these embeddings by cell type per patient, and trained classifiers to predict disease. When new patients resembled those in the training data, performance was excellent. But when samples came from completely independent studies using different laboratory methods, accuracy dropped sharply, revealing how sensitive such tools are to technical variability. A more controlled “centralized” dataset, generated at one center with a single sequencing chemistry, restored much of the performance, pointing to the need for standardized protocols or very large, diverse training sets.
What this means for future diagnosis and treatment
For a layperson, the key message is that your circulating immune cells carry a rich fingerprint of how your body is inflamed. By reading these fingerprints cell by cell, this work shows it is possible to distinguish between many diseases, to discover genes that may drive specific symptoms and to begin building universal blood tests that classify inflammatory illnesses. The study is not yet a ready-made clinical test—technical differences between studies still limit reliability—but it lays the groundwork for future “liquid biopsy” tools that could help doctors identify the right diagnosis and treatment earlier, using a simple blood draw.
Citation: Jiménez-Gracia, L., Maspero, D., Aguilar-Fernández, S. et al. Interpretable inflammation landscape of circulating immune cells. Nat Med 32, 633–644 (2026). https://doi.org/10.1038/s41591-025-04126-3
Keywords: inflammation, immune cells, single-cell RNA sequencing, biomarkers, machine learning