Clear Sky Science · en
Wide-swath altimetry maps bank shapes and storage changes in global rivers
Why watching rivers from space matters
Rivers supply drinking water, grow our food and support rich ecosystems, yet we still do not know, in a precise way, how much water they store or how that storage rises and falls through the year. As climate change brings harsher droughts and floods, and more people depend on already stressed rivers, this blind spot becomes dangerous. This study uses a new satellite mission to produce the first near-global picture of how the world’s largest rivers change shape and how much water they hold from month to month, revealing surprises that challenge long-standing computer models of Earth’s water cycle.
Taking the measure of rivers from orbit
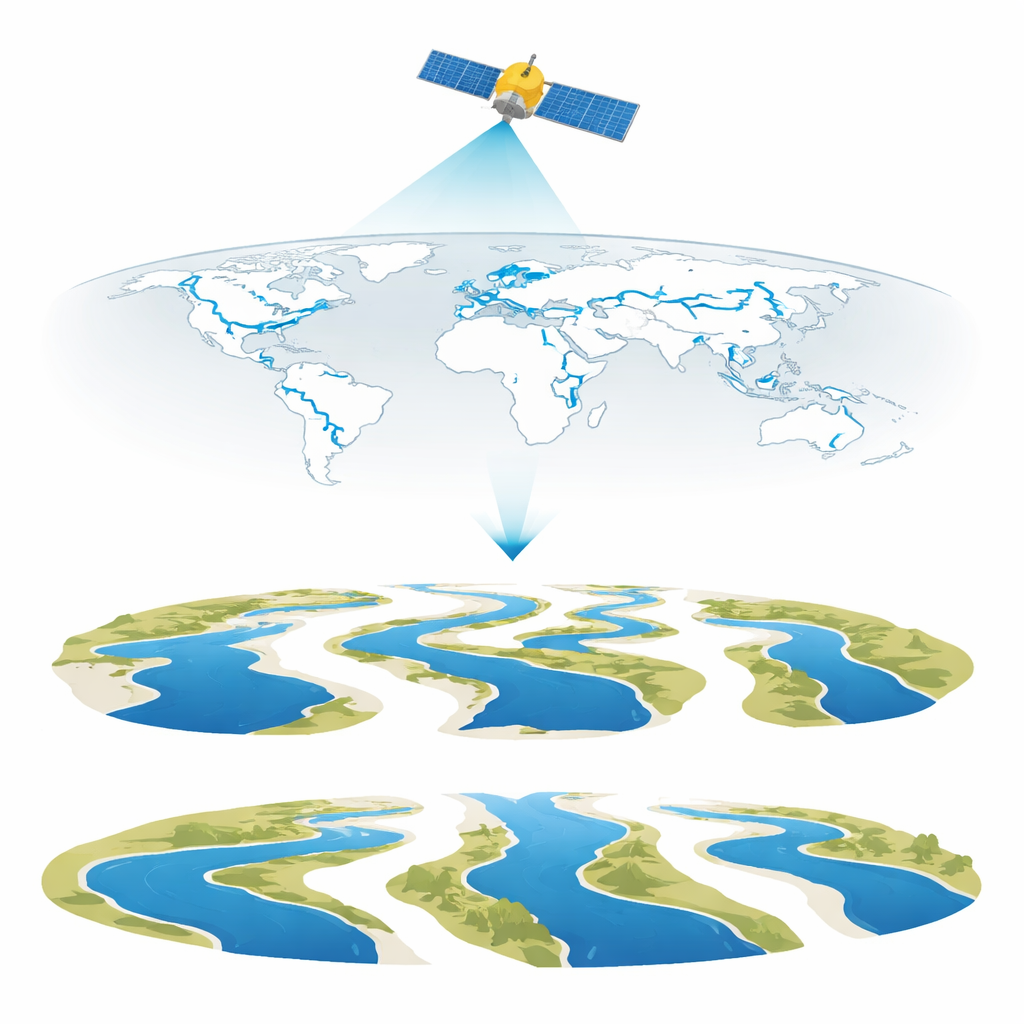
The work is built around SWOT, a joint NASA–CNES satellite launched in late 2022 specifically to measure surface water. Unlike earlier missions that traced narrow ground tracks over the oceans, SWOT scans wide swaths across the continents, measuring both the height of the water surface and the width of rivers, lakes and wetlands in a single pass. For this study, the team focused on 126,674 river segments, each about 10 kilometers long, on rivers wider than 30 meters—together covering roughly three quarters of Earth’s widest rivers. Over the first full “water year” of SWOT’s science orbit, from October 2023 to September 2024, they carefully filtered about 1.65 million individual observations to remove readings affected by ice, poor viewing angles or other problems, ending up with an average effective revisit time of about 28 days for most basins.
Hidden shapes of the world’s river corridors
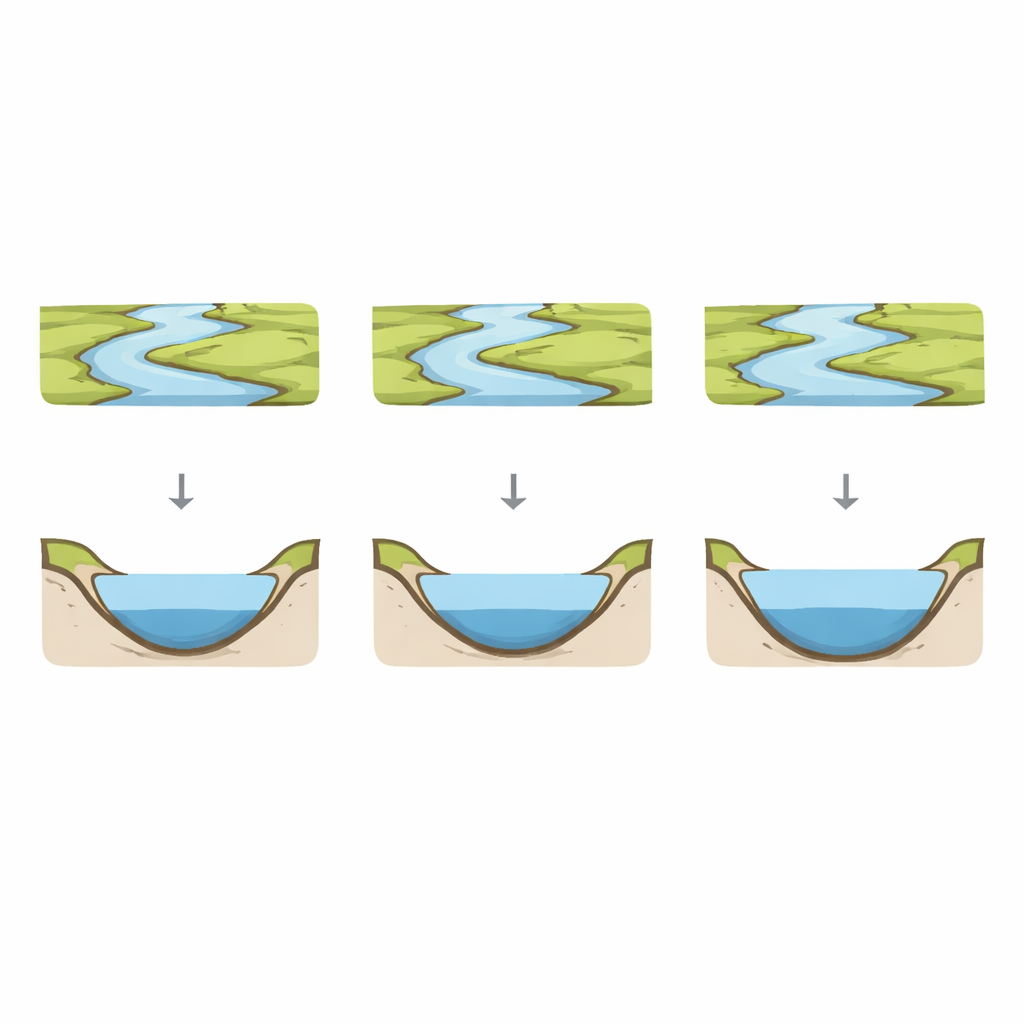
By pairing width and height measurements at each segment, the researchers reconstructed the active “corridor” of each river—the cross-section between the lowest and highest water levels SWOT observed that year. These shapes, which describe how a river widens or deepens as it fills, turned out to be remarkably varied. Some channels were steep and narrow, others broad and gentle; some cross-sections bowed inward, others outward. Major rivers with similar average flow, such as the Mississippi and the Yenisei or the Orinoco and the Congo, displayed very different corridor shapes and ranges in water level. This diversity confirms that the simplified, one-size-fits-all geometries commonly used in global river models miss important real-world variation in how rivers store and convey water, and it offers the first consistent, observation-based atlas of active riverbed forms at planetary scale.
Following the pulsing of river water through the year
From these corridor shapes, the team could calculate how the cross-sectional area of each river segment changed over time and convert that to volume changes—monthly “anomalies” in how much water was stored relative to a reference level. Mapping when each segment reached its annual maximum revealed seasonal patterns that broadly follow climate zones: for instance, peak volumes in much of the Amazon during March to May, and in different seasons across the Congo basin, in line with previous regional studies. Calculating the range between the lowest and highest monthly values highlighted hotspots of variability in giant systems such as the Amazon, Ganges–Brahmaputra, Congo, Yangtze, Mississippi and Ob, and showed that variability tends to grow downstream as rivers integrate more upstream area. Overall, the global annual swing in river water storage captured by SWOT was about 313 cubic kilometers, with typical individual segments showing changes of only a few thousandths of a cubic kilometer.
Checking against gauges and long-running models
Because no previous observing system has monitored river storage directly at this scale, the authors tested SWOT’s time series in two main ways. First, they compared seasonal patterns of storage from SWOT with decades of discharge records from 61 ground-based gauges spread across major basins. For most tropical, temperate and mid-latitude rivers, the timing of rises and falls matched well, though performance was poorer in Arctic and high-mountain regions where ice and snow limit usable observations. Second, they contrasted the new satellite-based storage variations with leading global model simulations that estimate river water volumes from rainfall and runoff. Even when restricted to the same river segments, SWOT’s global annual range in storage was roughly 28 percent smaller than the lowest of three model scenarios and far below older model-based estimates that also included floodplains. In some basins, such as the Nile, differences were dramatic, hinting at both unusual recent conditions—like the record Amazon drought—and deep-seated weaknesses in how models represent runoff and the speed of water movement.
What this means for water and risk
For non-specialists, the key message is that we are finally beginning to watch the world’s great rivers breathe in and out in near real time, rather than guessing from sparse data and simplified formulas. The first year of SWOT measurements shows that real rivers store and release less water than many models predicted, and do so through a richer variety of shapes and seasonal pulses than previously recognized. Although the current record is short and still affected by measurement gaps—especially in frozen regions—the approach opens a path to more realistic global models of surface water. Better knowledge of how much water rivers actually hold, how quickly it moves, and how these patterns shift during droughts and floods can ultimately help societies plan reservoirs, manage ecosystems and prepare for water-related disasters in a warming, more crowded world.
Citation: Cerbelaud, A., Wade, J., David, C.H. et al. Wide-swath altimetry maps bank shapes and storage changes in global rivers. Nature 651, 666–671 (2026). https://doi.org/10.1038/s41586-026-10218-y
Keywords: satellite river monitoring, global freshwater storage, SWOT mission, river drought and flood risk, hydrology from space