Clear Sky Science · en
Spatially explicit global assessment of cropland greenhouse gas emissions circa 2020
Why farm fields matter for the climate
Every meal you eat has a hidden climate footprint. Beyond trucks, factories and supermarkets, the very fields where crops grow release powerful greenhouse gases into the air. This study asks a simple but pressing question: where, exactly, are those emissions coming from, and how much do different crops contribute? By building the most detailed global maps to date of greenhouse gas emissions from croplands around 2020, the authors show which farming systems are the biggest culprits, which crops are most efficient at producing food, and where climate action can cut pollution without threatening food supplies.
Taking a global snapshot of farm pollution
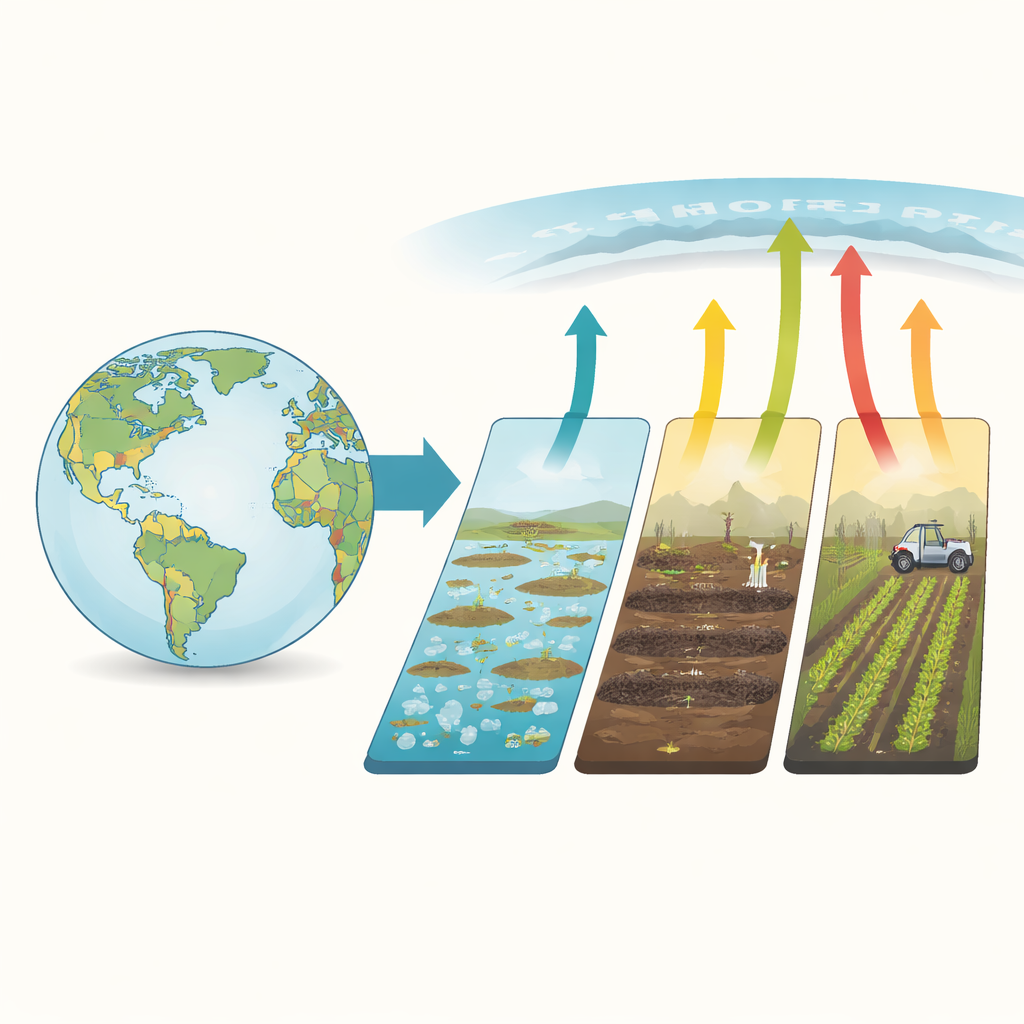
The researchers stitched together a vast set of data on how crops are grown across the planet: where fertilizers are used, where animal manure is spread, how crop leftovers are handled, how rice fields are flooded, and where peat-rich wetlands have been drained for agriculture. They combined this information at very fine spatial detail—roughly 10 kilometers by 10 kilometers—covering 46 types of crops. Using standard climate accounting methods, they converted all emissions into a common unit so that gases like carbon dioxide, methane and nitrous oxide could be compared and added up. This approach allowed them to calculate not only total emissions, but also emissions per hectare of land and per calorie of food produced.
Where the biggest farm emissions come from
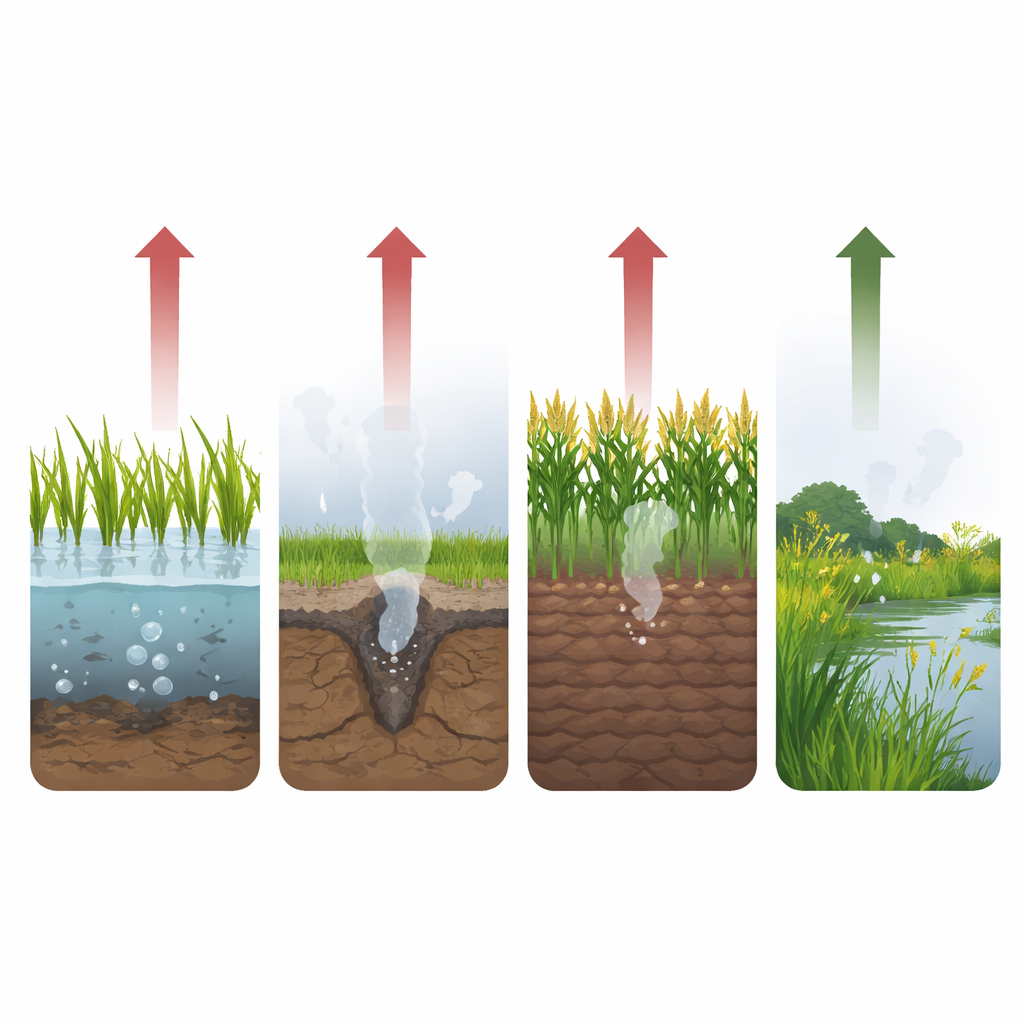
The global picture is striking. In 2020, croplands emitted about 2.5 billion tonnes of carbon dioxide equivalent—roughly one in every 25 tonnes of human-caused climate pollution worldwide. A handful of sources dominate this total. Drained peatlands, where carbon-rich wet soils have been dried out for crops like oil palm, produced around 35% of cropland emissions. Flooded rice paddies, which generate methane as microbes break down organic matter without oxygen, contributed another 35%. Synthetic nitrogen fertilizer, widely used to boost yields in cereals such as maize and wheat, added about 23%. Four crops—rice, maize, oil palm and wheat—were responsible for two-thirds of all cropland emissions, even though many other crops are grown worldwide.
Hotspots and trade-offs across regions and crops
Emissions are not evenly spread. On average, each hectare of cropland released about two tonnes of greenhouse gases in 2020, but intensively farmed regions in Asia and Europe emitted much more per hectare, while parts of Africa and South America emitted much less. Yet the high-emission regions also produced far more calories per unit of land, making them critical for feeding large populations. Rice fields in Asia, for example, deliver about 30% of the region’s calories but generate 43% of global cropland emissions. Oil palm plantations occupy only a small fraction of cropland area but rank among the most polluting per hectare because they are often planted on drained peat. In contrast, crops like soybean and many root and tuber crops can deliver substantial food with relatively modest emissions per hectare.
How farming has changed in two decades
Looking back to around the year 2000, the study finds that crop harvests, fertilizer use and residue returns to the soil have all risen sharply. Total crop production increased by about half, while nitrogen fertilizer and crop residues left on or burned in fields increased by more than a third. Rice area expanded modestly, but improved data and more realistic models reveal that methane from rice is higher than older estimates suggested, especially in Asia. Drained peatland emissions also crept upward as more wetlands were converted to cropland. Together, these trends show that as agriculture has intensified to feed more people, its climate impact has also grown, even when yields have improved.
Paths to cleaner food without empty plates
The authors emphasize that the same regions and crops that feed the world efficiently are often those with the highest emissions. That means simple across-the-board cuts could harm food security. Instead, the new maps point to targeted solutions: rewetting drained peatlands to keep carbon in the ground; changing rice water management and straw handling to curb methane; and improving fertilizer practices so crops use more nitrogen and less is lost as nitrous oxide. The study’s detailed, location-specific data give researchers and policymakers a common, transparent framework to identify hotspots and weigh trade-offs between climate and food. In plain terms, it offers a roadmap for growing enough food while warming the planet less.
Citation: Cao, P., Bilotto, F., Gonzalez Fischer, C. et al. Spatially explicit global assessment of cropland greenhouse gas emissions circa 2020. Nat. Clim. Chang. 16, 354–363 (2026). https://doi.org/10.1038/s41558-026-02558-4
Keywords: cropland emissions, rice paddies, peatlands, fertilizer use, climate-friendly farming