Clear Sky Science · en
SMART: spatial multi-omic aggregation using graph neural networks and metric learning
Seeing Tissues as Neighborhood Maps
Our bodies are made of bustling cellular neighborhoods, where genes, proteins, and DNA packaging all work together in precise locations. New microscopes and sequencing tools can now read many of these molecular layers directly inside thin slices of tissue, but turning this flood of multi-layered, spatial data into clear pictures of how organs are organized is a huge computational challenge. This study introduces SMART, a computer method that helps scientists fuse these complex signals into detailed maps of where different cell communities live and how they are arranged.
Why Mapping Cell Neighborhoods Is Hard
Modern "spatial multi-omics" technologies can measure several kinds of molecular information at once—such as RNA, proteins on the cell surface, and how open or closed the DNA is—while keeping track of each measurement’s exact position in a tissue slice. Each type, or "omic," offers a different view of cell behavior, but they are noisy, high‑dimensional, and do not naturally line up with one another. On top of that, cells of the same type are not always clustered together; they can appear as scattered islands across an organ. Existing software tools often either ignore the spatial layout, oversimplify how the different omics relate to one another, or struggle to scale to the very large datasets that new instruments can produce.
A Graph of the Tissue, Not Just a List of Cells
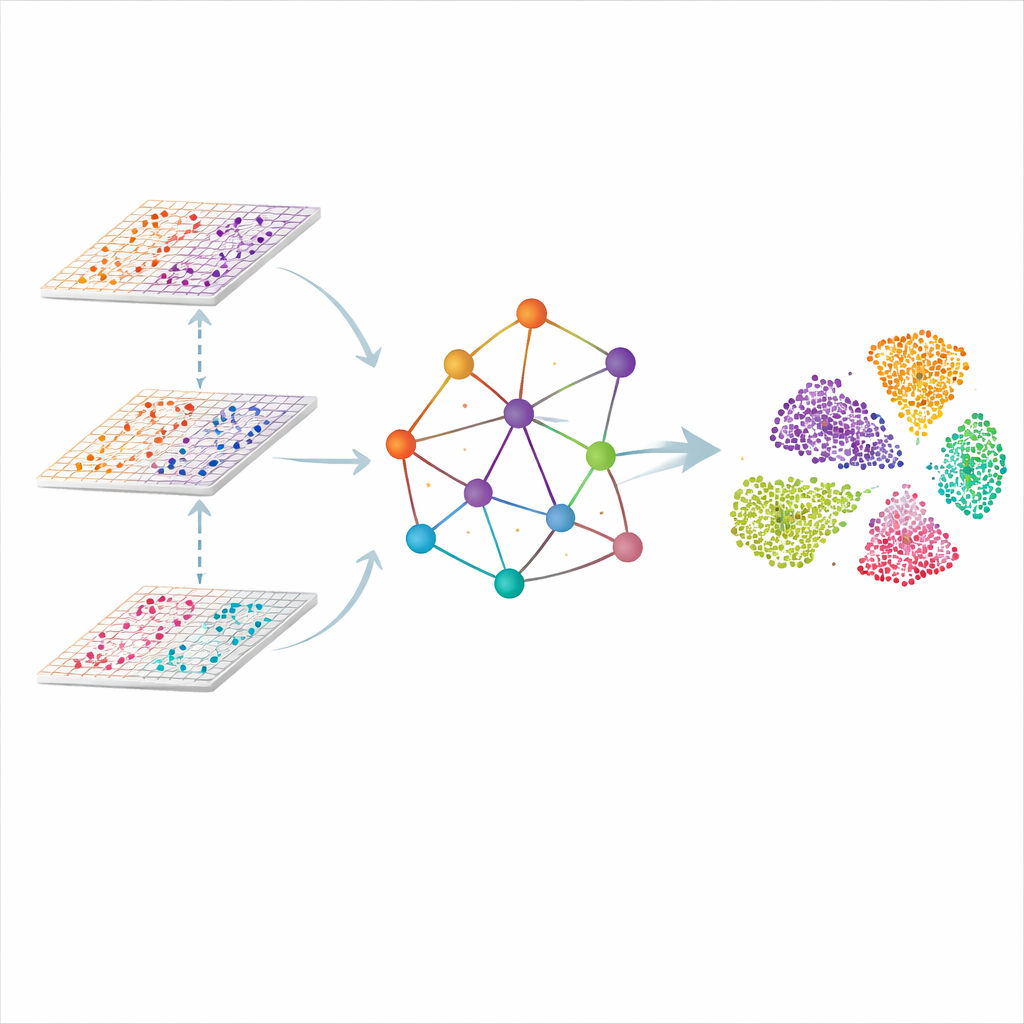
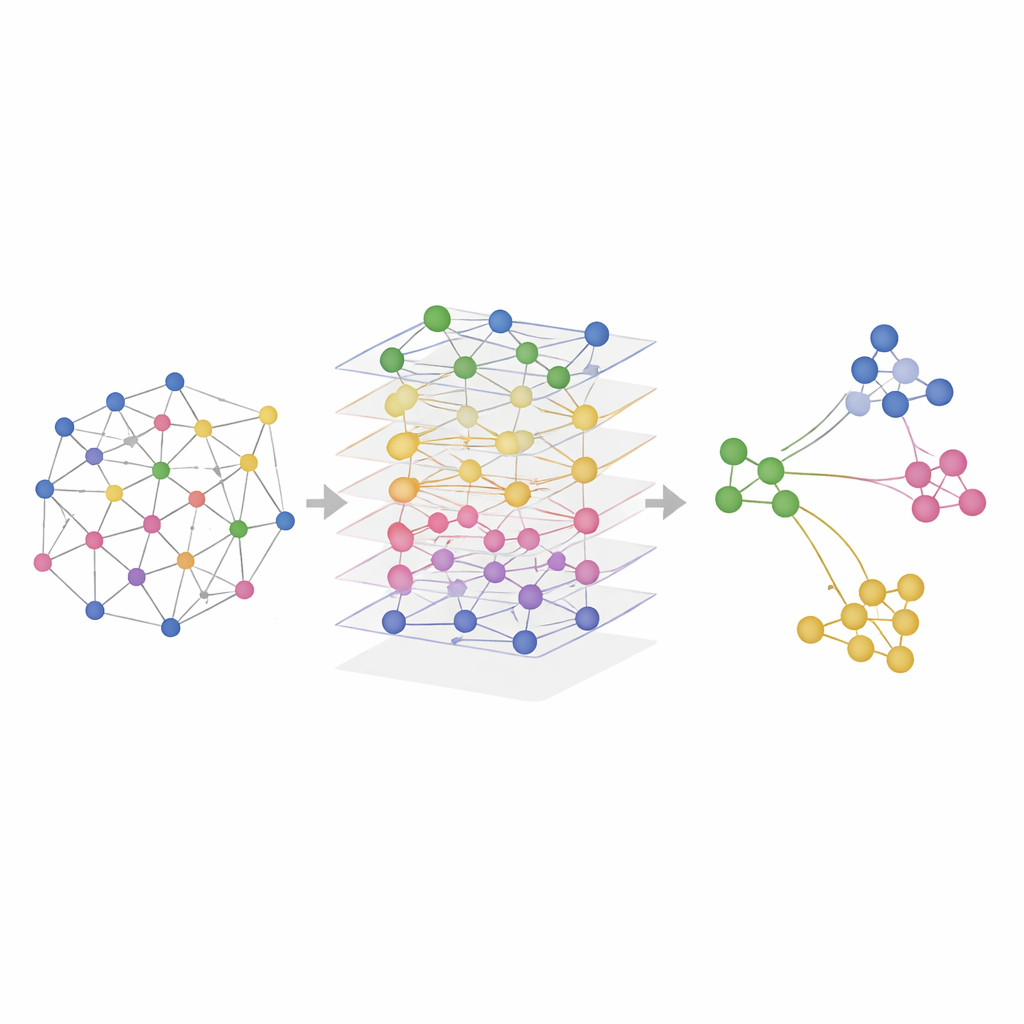
SMART approaches the problem by treating each measurement spot in the tissue as a point in a network. Nearby spots are linked to form a spatial graph, and the molecular readouts from each omic are first compressed into a smaller set of coordinated features that capture overall patterns rather than individual genes. A kind of neural network designed for graphs then passes information along the links, letting each spot "listen" to its neighbors while keeping track of how each omic contributes. The result is a shared, low‑dimensional representation in which similar regions in the tissue—such as distinct layers of the brain or zones of a lymph node—naturally group together.
Teaching the Model What Should Be Similar
Simply following physical neighbors is not enough, because cells of the same type can be far apart. SMART adds a second ingredient borrowed from face‑recognition systems: metric learning with triplets. For each spot, the method automatically finds another spot with very similar molecular patterns (a "positive") and one that is clearly different (a "negative"). It then adjusts the internal representation so that positives are pulled closer and negatives pushed farther away, even if they are distant on the tissue slide. This tug‑of‑war runs alongside a reconstruction step that forces SMART to preserve the key details of each omic layer, balancing spatial continuity with molecular specificity.
Putting SMART to the Test in Real Tissues
The researchers tested SMART on both simulated data and real experiments that measured combinations of RNA, proteins, and chromatin accessibility in mouse brains, mouse spleens, human lymph nodes, and tonsils. In controlled simulations where the true spatial regions were known, SMART most accurately recovered the ground‑truth patterns and maintained the relationships present in each omic layer. On real datasets, SMART consistently identified fine anatomical structures—such as specific brain regions or immune cell zones in lymphoid organs—more sharply than competing methods, while also keeping computational demands low. A related version, called SMART‑MS, extends the same ideas across multiple tissue sections, aligning slices from the same organ and correcting for technical differences between experiments.
Fast Maps for the Next Wave of Spatial Biology
In plain terms, SMART is a map‑making engine for the next generation of molecular atlases. By combining network‑style modeling of tissue layout with a built‑in sense of what should count as "similar," it can turn vast, messy collections of spatial multi‑omics measurements into coherent neighborhood maps of organs. This allows researchers to more easily spot where particular cell types and microenvironments reside, how they change during development or disease, and how new experimental technologies fit together. As spatial data continue to grow in size and complexity, tools like SMART and SMART‑MS will be key to turning raw measurements into biological insight.
Citation: Du, Z., Chen, Q., Huang, W. et al. SMART: spatial multi-omic aggregation using graph neural networks and metric learning. Nat Commun 17, 2876 (2026). https://doi.org/10.1038/s41467-026-70821-5
Keywords: spatial multi-omics, graph neural networks, tissue microenvironment, data integration, single-cell biology