Clear Sky Science · en
A spatially resolved human glioblastoma atlas reveals distinct cellular and molecular patterns of anatomical niches
Why this brain cancer map matters
Glioblastoma is one of the deadliest brain cancers, in part because each tumor is a patchwork of different cell types and micro-environments. Standard scans and lab tests mostly see the tumor as a single mass. This study builds a high‑resolution “atlas” that shows where every major cell type sits inside human glioblastomas, how these cells cluster into distinct neighborhoods, and how some of these neighborhoods may help drive tumor regrowth and shorten patient survival.
Looking at tumors like city maps
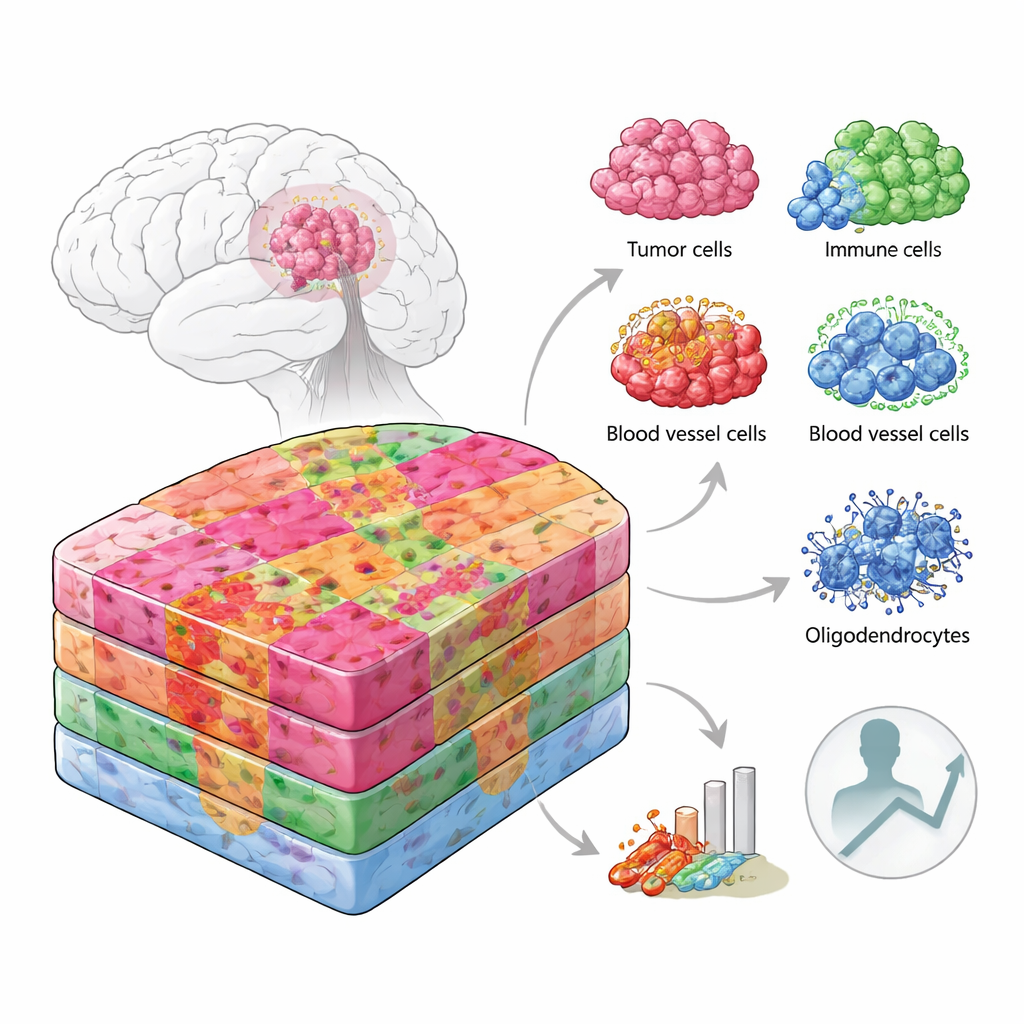
Instead of treating a tumor slice as uniform, the researchers approached it like a city map, where each district has its own layout and residents. They combined several cutting‑edge techniques that read out gene activity from thousands of tiny spots across tumor tissue, and matched this to single‑cell data and protein measurements. Importantly, they did this not only on fresh-frozen samples from the operating room but also on routinely archived, wax‑embedded hospital tissue, which is what most pathology labs actually store. In total they analyzed more than 100,000 spatially barcoded regions and over 220,000 individual cells from patients of different ages and genetic backgrounds, covering both the dense tumor core and its more diffuse edges.
Hidden neighborhoods inside glioblastoma
By overlaying gene activity on high‑magnification microscope images, the team divided each tumor into anatomical “niches,” such as the leading edge where cancer cells infiltrate normal brain, the crowded central zones, areas rich in blood vessels, and regions surrounding dead or oxygen‑starved tissue. Each niche turned out to host its own mix of cell types. The tumor edge in gray matter was rich in neurons and typical support cells, while the edge in white matter contained many oligodendrocytes, the cells that normally insulate nerve fibers. Certain vascular niches were packed with specialized blood‑vessel and support cells, while others were dominated by immune cells and scar‑like tissue. Hypoxic zones near dead tissue held mostly aggressive, mesenchymal‑like tumor cells and macrophages, with far less cellular diversity.
A surprising role for support cells
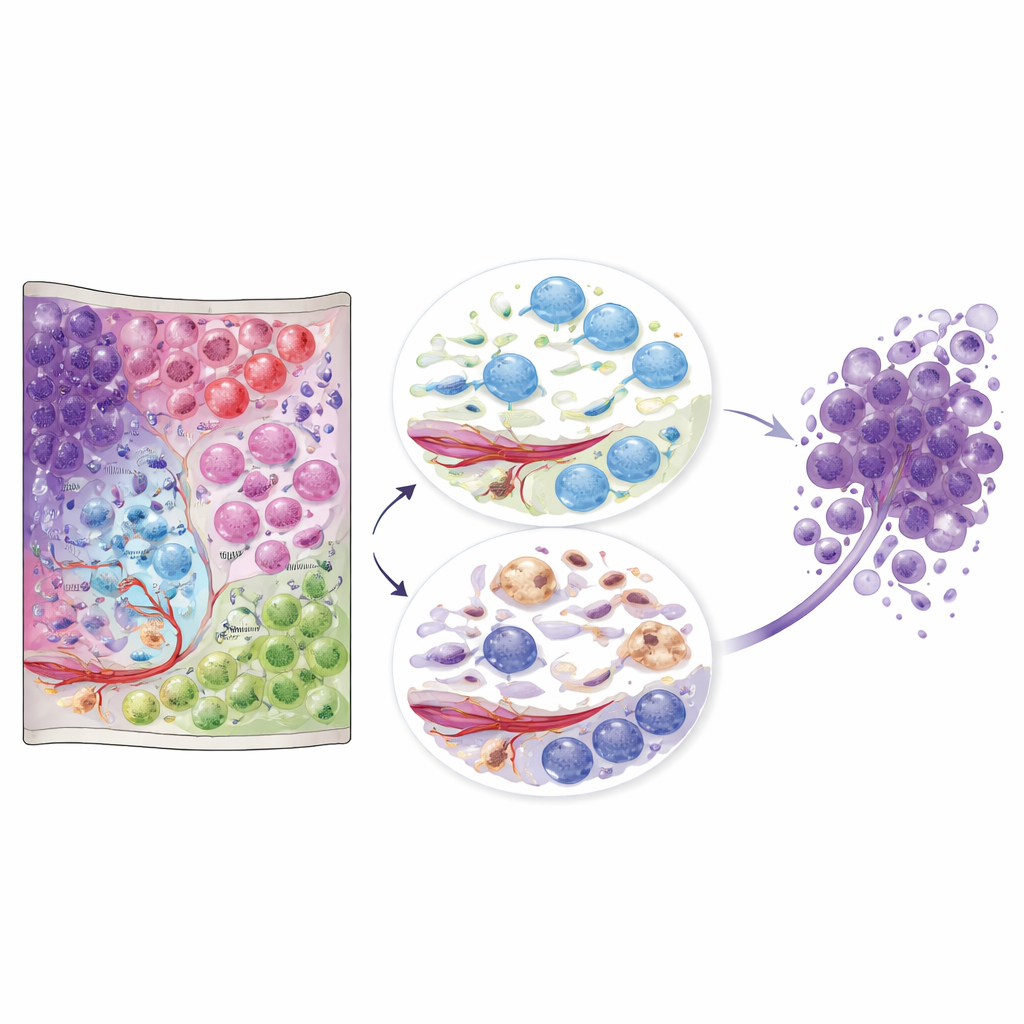
One of the most striking findings involved oligodendrocytes, usually thought of as quiet “insulators” in the brain. The atlas revealed four distinct oligodendrocyte states, including a previously underappreciated type that appeared almost exclusively in the cores of glioblastomas. These cells had lost many of their myelin‑related genes and instead switched on genes linked to inflammation and stress, resembling disease‑associated oligodendrocytes seen in multiple sclerosis and other brain disorders. Spatially, this immune‑like oligodendrocyte population clustered in an “immune–glial niche” alongside activated microglia, macrophages, abnormal blood‑vessel cells, and mesenchymal‑like tumor cells, but notably not in the most oxygen‑starved regions.
Linking microscopic patterns to patient outcome
The authors then asked whether the gene programs that define these oligodendrocyte states show up in large collections of tumor samples linked to patient records. Across two independent glioma cohorts, a signature of conventional, myelin‑producing oligodendrocytes was associated with better survival, even after accounting for age and key genetic risk markers. In contrast, the immune‑activated oligodendrocyte signature tracked with worse survival and was more prominent in aggressive, treatment‑resistant tumors, especially those that had come back after therapy and lacked a common DNA repair–related methylation change. This suggests that how oligodendrocytes are reprogrammed inside the tumor, and where they sit relative to tumor and immune cells, may influence how the disease responds to treatment and how likely it is to recur.
What this atlas means for future care
Together, these data turn glioblastoma from a blurry mass into a detailed landscape of interacting cell communities. For non‑specialists, the key message is that location and neighbors matter: the same broad cell types behave very differently depending on the niche they occupy. The publicly available atlas offers a reference that other researchers and clinicians can use to place their own samples into this spatial context. In the long run, therapies might be designed not just to kill tumor cells, but to disrupt harmful niches—such as immune‑scar regions or immune‑activated oligodendrocyte pockets—that appear to foster tumor survival and relapse.
Citation: Sonpatki, P., Park, H.J., Xing, Y.L. et al. A spatially resolved human glioblastoma atlas reveals distinct cellular and molecular patterns of anatomical niches. Nat Commun 17, 2951 (2026). https://doi.org/10.1038/s41467-026-69716-2
Keywords: glioblastoma, spatial transcriptomics, tumor microenvironment, oligodendrocytes, brain cancer atlas