Clear Sky Science · en
An absolute quantification atlas of small non-coding RNAs across diverse mammalian tissues and cell lines
Why tiny RNA molecules matter
Inside every cell, fleets of tiny RNA molecules help decide which genes are turned on or off. These small non‑coding RNAs act like dimmer switches for our genetic programs, shaping development, organ function, and disease. Yet, despite powerful sequencing technologies, scientists have struggled to measure exactly how many of these molecules are present in different cells and tissues. This study introduces a more accurate way to count them and builds a detailed atlas that shows their true abundance across many mammalian tissues and common laboratory cell lines.
A clearer way to count small RNAs
Traditional methods for sequencing small RNAs rely on enzymes that attach adapter pieces before reading the molecules. Those enzymes prefer certain shapes and chemical endings, so some RNAs are captured efficiently while others are missed or undercounted. This bias is especially severe for particular classes such as piRNAs and plant small RNAs, which carry protective chemical caps on their ends. The authors created a new protocol, called 4NBoost, that redesigns the adapters and reaction conditions to even out these preferences and adds built‑in molecular barcodes to tell apart true molecules from copies made during amplification.
Turning a protocol into a measuring tool
To transform 4NBoost from a relative readout into an actual measuring tool, the team added carefully designed synthetic “spike‑in” RNAs at known concentrations spanning a very wide range. By comparing how many times each spike‑in was read by the sequencer to how much was originally added, they built standard curves that convert read counts into absolute molecule numbers. Tests with different spike‑in mixtures and added control RNAs showed that 4NBoost could track abundance accurately over several orders of magnitude, including RNAs with troublesome chemical modifications. Even when starting from as little as one nanogram of total RNA, the method still faithfully captured the small‑RNA landscape.
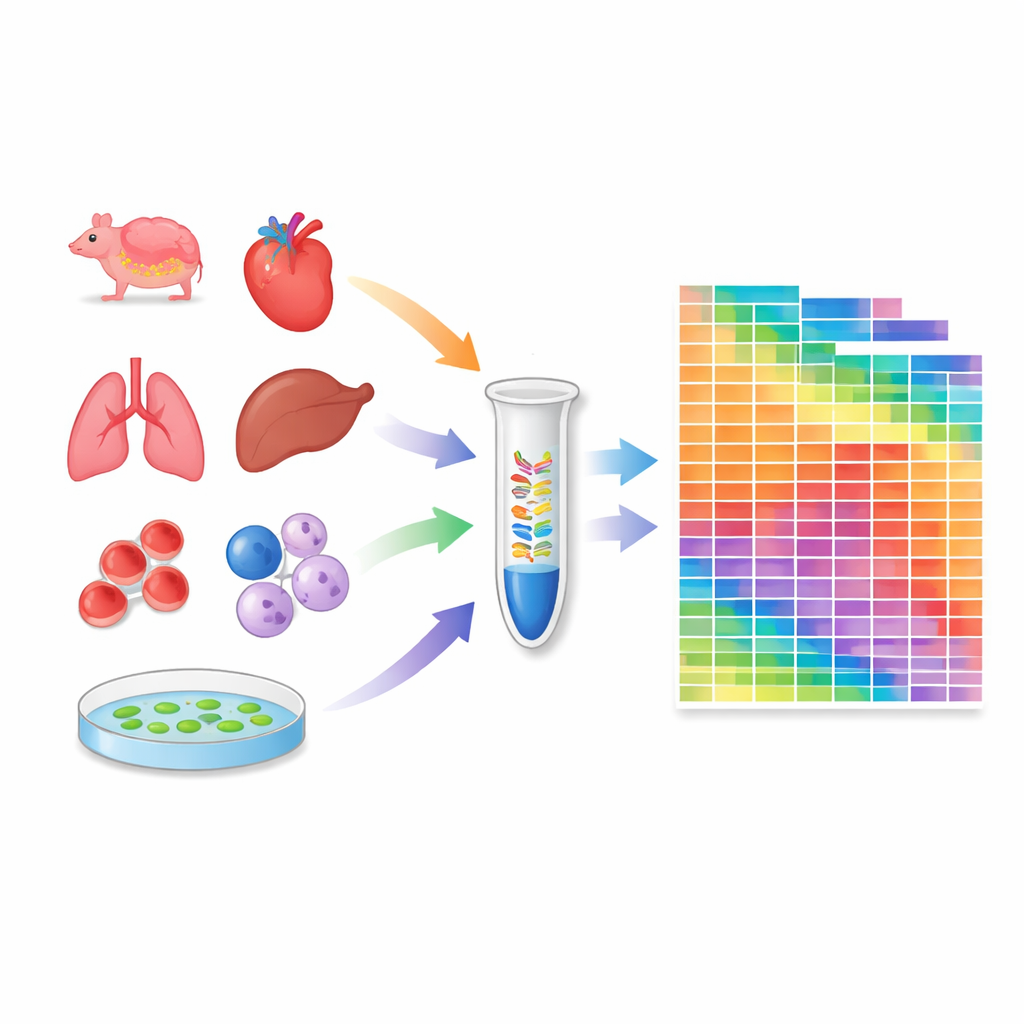
Building an atlas across tissues and cell lines
Armed with this calibrated protocol, the researchers profiled 259 samples: 20 tissues from mice, 18 from crab‑eating macaques, 24 widely used human and mouse cell lines, and several tissues from the model plant Arabidopsis. For each sample, they estimated the absolute number of molecules for thousands of microRNAs and piRNAs. This revealed how many different microRNA species are present in each context and how their total amounts vary between tissues and species. Some cell lines and organs carry especially rich microRNA repertoires, while others, such as blood cells, are dominated by a few highly abundant species. The atlas also exposed substantial differences between mouse and monkey tissues, underlining that small‑RNA regulation can be species‑specific.
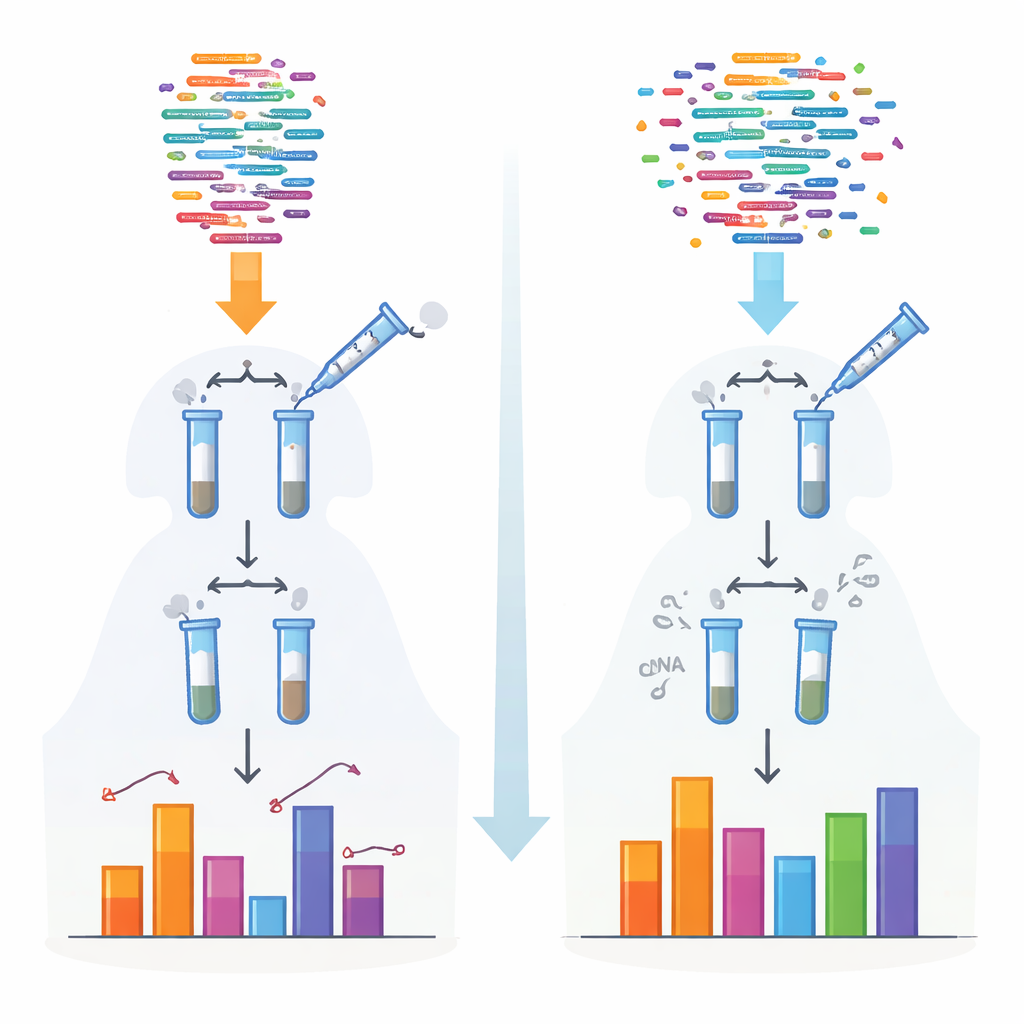
Correcting old data and revising common assumptions
When the new atlas was compared with popular small‑RNA databases built using conventional methods, striking mismatches appeared. Several important microRNA families—such as miR‑19 and miR‑29—were found to be far more abundant than previously thought, while others—such as the widely studied let‑7 and miR‑10 families—were often overestimated. The study also re‑examined which “arm” of each precursor hairpin is actually used in cells, uncovering cases where current annotations list the wrong major strand. To rescue the wealth of existing biased datasets, the authors trained a machine‑learning model that learns how conventional measurements deviate from 4NBoost and then mathematically corrects them to better reflect true abundances.
A public resource for exploring small RNAs
All of the 4NBoost measurements and the correction model are made freely available through an online platform called SmRNAQuant. Researchers can browse or download absolute small‑RNA levels for specific tissues, cell lines, or microRNAs, and can upload their own data prepared with a common kit to obtain bias‑corrected values. For non‑specialists, the key message is that counting matters: tiny differences in small‑RNA copy number can spell the difference between active gene regulation and no effect at all. By offering more trustworthy numbers and a way to fix older data, this work lays a stronger quantitative foundation for understanding how small RNAs shape normal biology and disease.
Citation: Xiao, W., Zheng, Y., Zhang, H. et al. An absolute quantification atlas of small non-coding RNAs across diverse mammalian tissues and cell lines. Nat Commun 17, 2314 (2026). https://doi.org/10.1038/s41467-026-68812-7
Keywords: microRNA quantification, small noncoding RNA, RNA sequencing bias, tissue expression atlas, machine learning correction