Clear Sky Science · en
Metabolic characterization of tumor-immune interactions by multiplexed immunofluorescence reveals spatial mechanisms of immunotherapy response in non-small cell lung carcinoma (NSCLC)
Why this research matters
Immunotherapy has transformed treatment for some people with advanced lung cancer, yet most patients still see their cancer grow despite these powerful drugs. This study asks a simple but crucial question: can we look more closely at the cancer tissue itself—at where different cells sit and how much energy they use—to predict who will truly benefit from immunotherapy? By turning tiny biopsy samples into detailed cellular maps, the researchers aim to move lung cancer care closer to a genuinely personalized approach.
Looking inside lung tumors like a city map
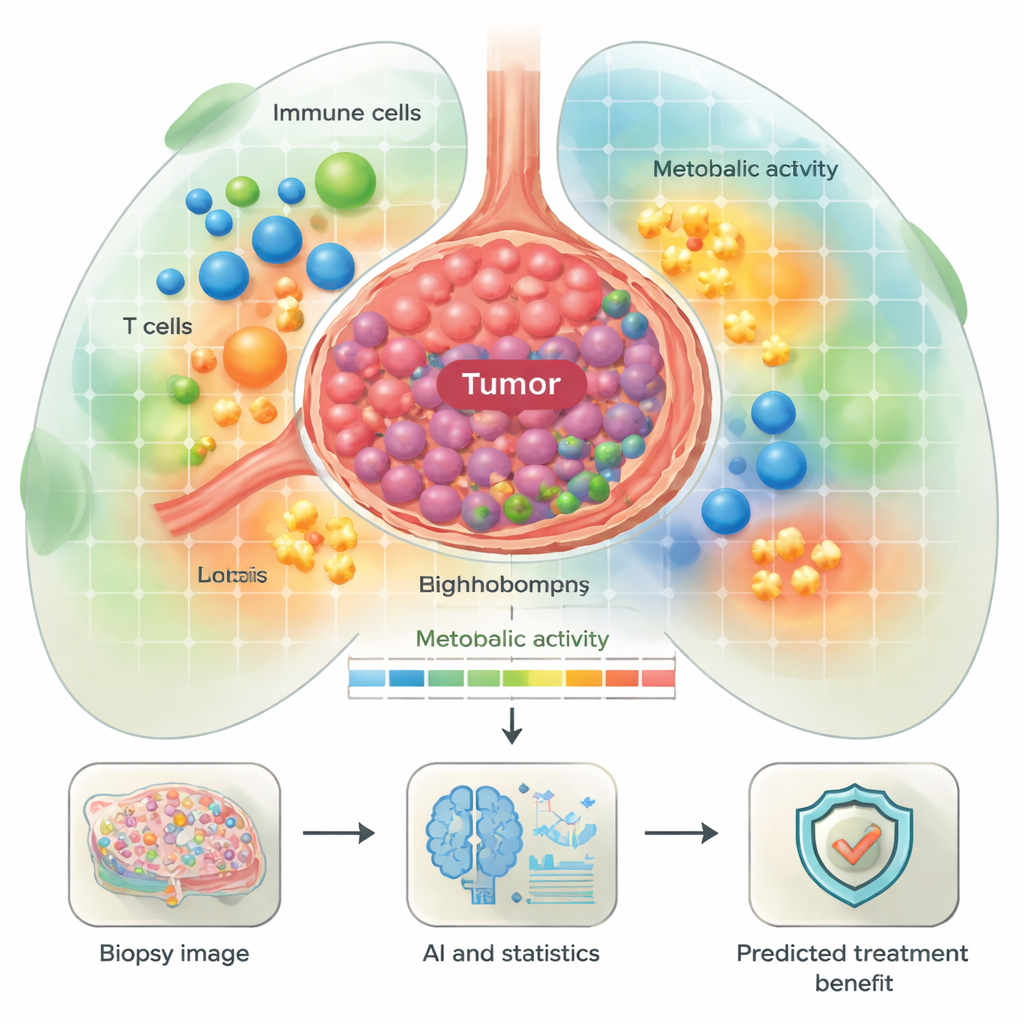
The team examined tissue from 55 people with advanced non-small cell lung carcinoma (NSCLC) who were treated with immune checkpoint inhibitors, a major class of immunotherapy drugs. Before treatment, their tumor samples were stained with a 44-marker panel using multiplexed immunofluorescence, allowing many proteins to be seen at once. A deep-learning system then identified key cell types—such as tumor cells, T cells, B cells, macrophages, and fibroblasts—and classified their functional state (for example, activated, dividing, or exhausted) as well as their metabolic profile, meaning how they were producing and using energy. Instead of just counting cells, the researchers also mapped where cells were in relation to each other, creating neighborhood-like regions within each biopsy.
Energy-hungry tumors and their immune surroundings
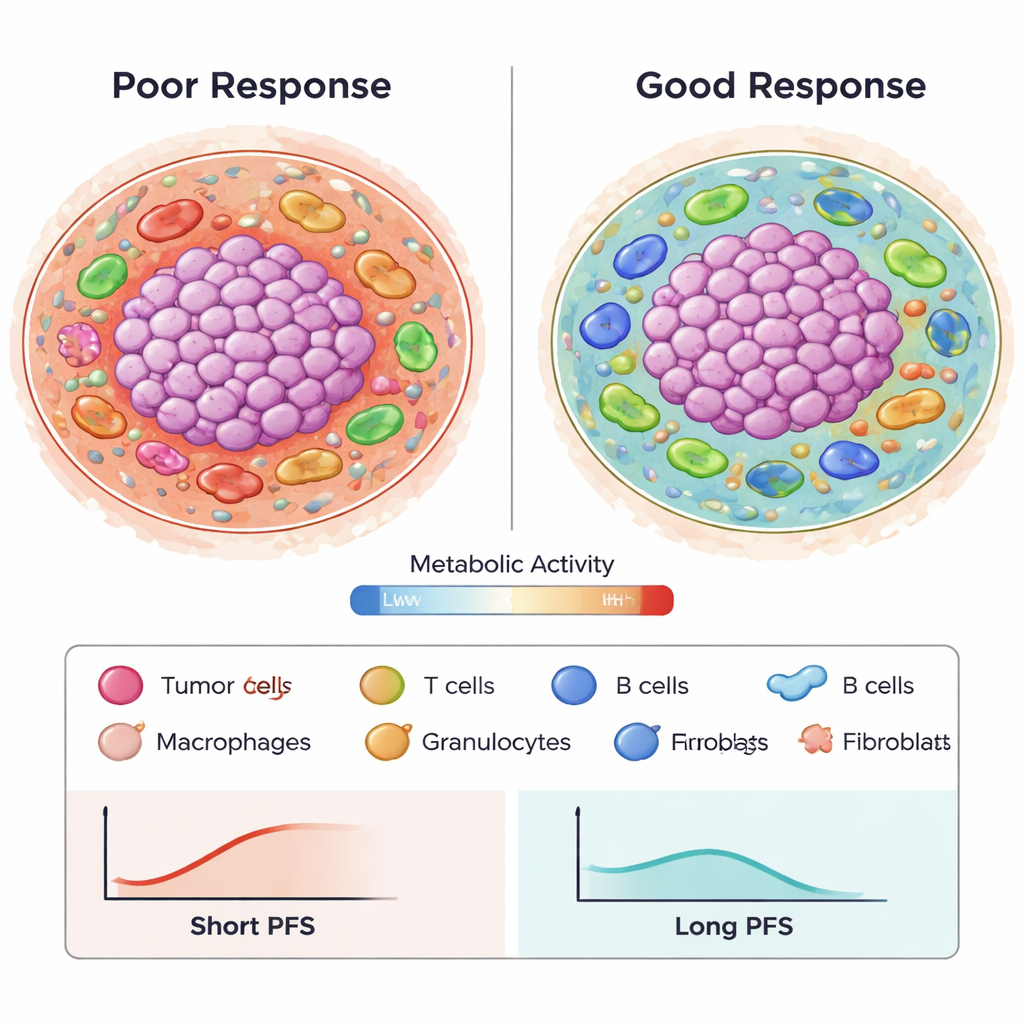
One major focus was metabolism—the ways cells generate fuel to grow or fight disease. The researchers defined “metabolic neighborhoods” with different levels and types of energy use, from low activity to highly active zones rich in oxidative phosphorylation and glycolysis. They found that both tumor cells and certain immune cells, like macrophages, often showed strong energy-producing pathways. Some of these patterns linked to patient outcomes. For example, tumors with high activity in pathways that help them use amino acids and run the TCA cycle tended to belong to patients who relapsed early after immunotherapy. In contrast, some plasma cells (antibody-producing B cells) with active energy pathways within the tumor were more common in patients who did better, hinting that not all energetic cells are harmful—some may support effective anti-tumor immunity.
Good and bad immune players in the tumor landscape
Beyond simple abundance, the type and behavior of immune cells also mattered. Macrophages carrying the cytotoxic molecule granzyme B were strongly associated with worse progression-free survival, especially when found in metabolically low or inactive neighborhoods. These regions may represent nutrient-poor or dormant areas where immune attack is blunted. By contrast, certain arrangements of regulatory T cells (Tregs) and fibroblasts at the boundary between tumor and surrounding tissue appeared to be linked with better outcomes, possibly reflecting a pattern where suppressive cells are held at the edges rather than infiltrating deep into the tumor. Ratios of different immune cells, such as granulocytes to CD8 T cells, also tracked with response, underscoring that the immune balance and positioning, not just total counts, are important.
From complex images to predictive patterns
To make sense of over a million engineered spatial features describing cell types, distances, and metabolic states, the authors used an advanced feature-selection method (Stabl) and survival modeling tools. They identified 87 key features, many reflecting how metabolically active tumor cells interact with macrophages and T cells, or how specific immune cell types cluster near blood vessels and fibroblasts. Using these features in Cox regression models, they built a predictor that estimated progression-free survival with an accuracy (AUC) around 0.8 over 24 months, outperforming traditional single markers like PD-L1 staining or tumor mutation burden in previously published work. Importantly, several features were reproducible across two independent patient cohorts, suggesting the patterns are not just random noise.
What this means for patients
For a layperson, the take-home message is that where cells sit in a lung tumor and how they fuel themselves may help explain why some patients respond well to immunotherapy while others do not. This study shows that rich spatial and metabolic information from a routine biopsy, combined with artificial intelligence and statistical modeling, can reveal signatures of likely benefit or resistance. Although the work needs validation in larger groups and in whole-tissue sections, it outlines a path toward future tests that could tell doctors, before treatment starts, which patients are more likely to gain durable control from immunotherapy and which may need alternative or combination strategies.
Citation: Monkman, J., Kilgallon, A., Lawler, C. et al. Metabolic characterization of tumor-immune interactions by multiplexed immunofluorescence reveals spatial mechanisms of immunotherapy response in non-small cell lung carcinoma (NSCLC). Nat Commun 17, 837 (2026). https://doi.org/10.1038/s41467-026-68633-8
Keywords: immunotherapy resistance, non-small cell lung cancer, tumor microenvironment, spatial biology, cancer metabolism