Clear Sky Science · en
Comprehensive benchmarking single and multi ancestry polygenic score methods with the PGS-hub platform
Why your DNA risk score matters
Doctors are getting better at reading our DNA to estimate who is more likely to develop common diseases such as heart disease, diabetes, or schizophrenia. These estimates, called polygenic scores, combine the tiny effects of many genetic variants into a single number. But there are now many competing ways to calculate such scores, and they don’t work equally well for people from different ancestral backgrounds. This study set out to compare leading methods head‑to‑head and to build an online service, PGS-hub, that lets researchers calculate these scores in a consistent, easy way.
A one-stop shop for DNA risk calculators
The authors created PGS-hub, a web platform that hides much of the technical complexity behind polygenic scores. Users upload genetic study results that summarize how millions of DNA markers relate to a disease or trait. They then choose the ancestral background of the population they care about—for example, European or African—and select from a menu of popular scoring methods. Behind the scenes, PGS-hub converts the input into the right formats, plugs in pre-built reference panels that describe how nearby DNA markers are correlated, and runs large numbers of jobs on a high‑performance computing system. The output is a compact file of weights that can be applied to individual genomes to generate a score for each person. 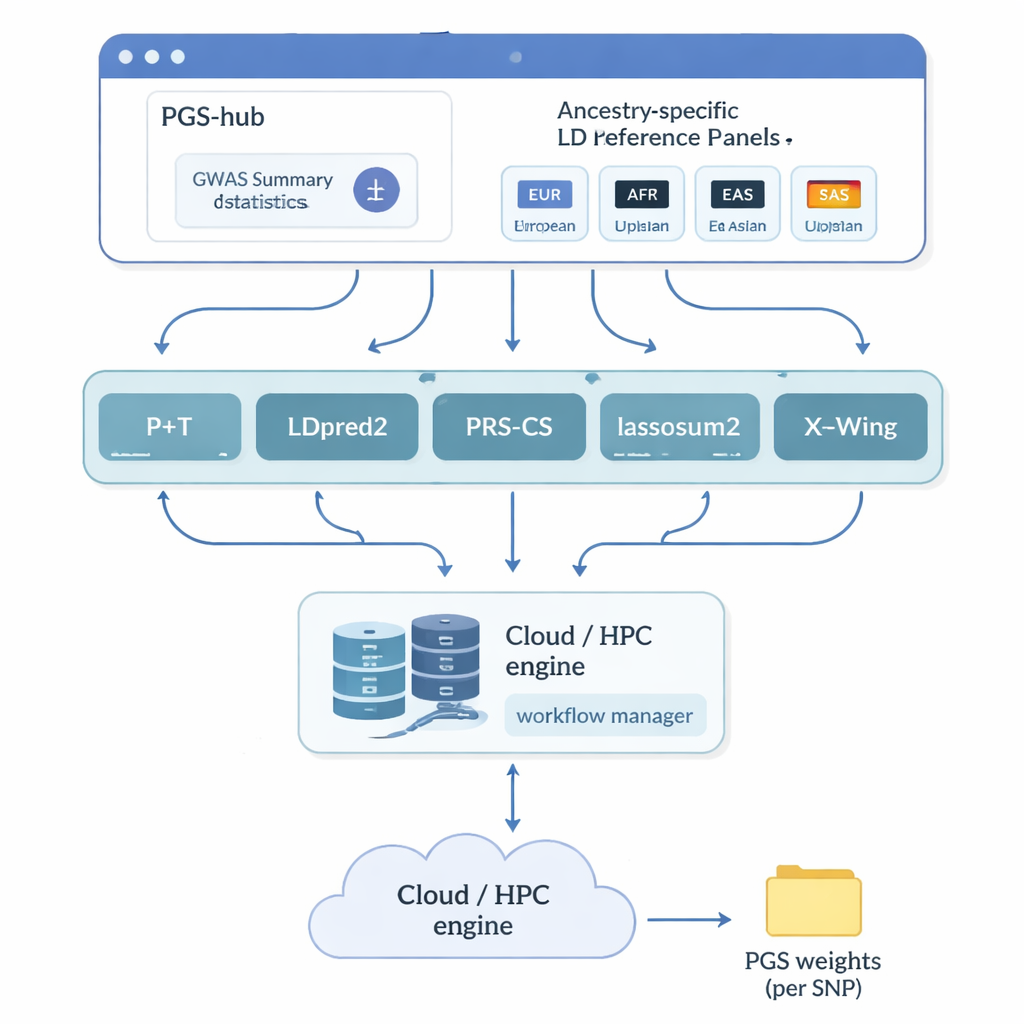
Putting 13 scoring methods to the test
To see which approaches work best, the team compared 13 state-of-the-art methods across 36 diseases and traits in nearly 380,000 people of European ancestry and just over 8,000 people of African ancestry from the UK Biobank. They evaluated not only how well each score predicted who had a disease or higher trait value, but also how much computer time and memory each method consumed. In Europeans, one method called LDpred2 generally delivered the most accurate scores, often beating others by a clear margin. A handful of alternatives—lassosum2, PRS-CS, and SDPR—performed nearly as well for many traits, while some older methods lagged behind. For traits like height or Crohn’s disease, the best scores explained a sizable share of genetic risk; for others, such as kidney function, all methods struggled, reflecting weaker underlying genetic signals.
Insights for diverse populations and combined methods
A major concern in genetic prediction is that methods trained mostly in Europeans may not transfer well to people with different ancestries. When the authors repeated their benchmarks using African-ancestry genetic studies, every method performed worse, highlighting the lack of large studies in these populations. Still, LDpred2 and SDPR tended to be among the better options. The team also examined “multi-ancestry” approaches that explicitly combine information across populations. Here, a relatively simple strategy—linearly combining the best ancestry-specific LDpred2 scores into a single LDpred2-multi score—beat more elaborate multi-ancestry models such as PRS-CSx and X-Wing for both European and African groups. On top of this, the authors showed that building an ensemble, which blends the strongest scores from multiple methods, further boosted prediction across all traits, especially for highly heritable diseases like schizophrenia and coronary artery disease. 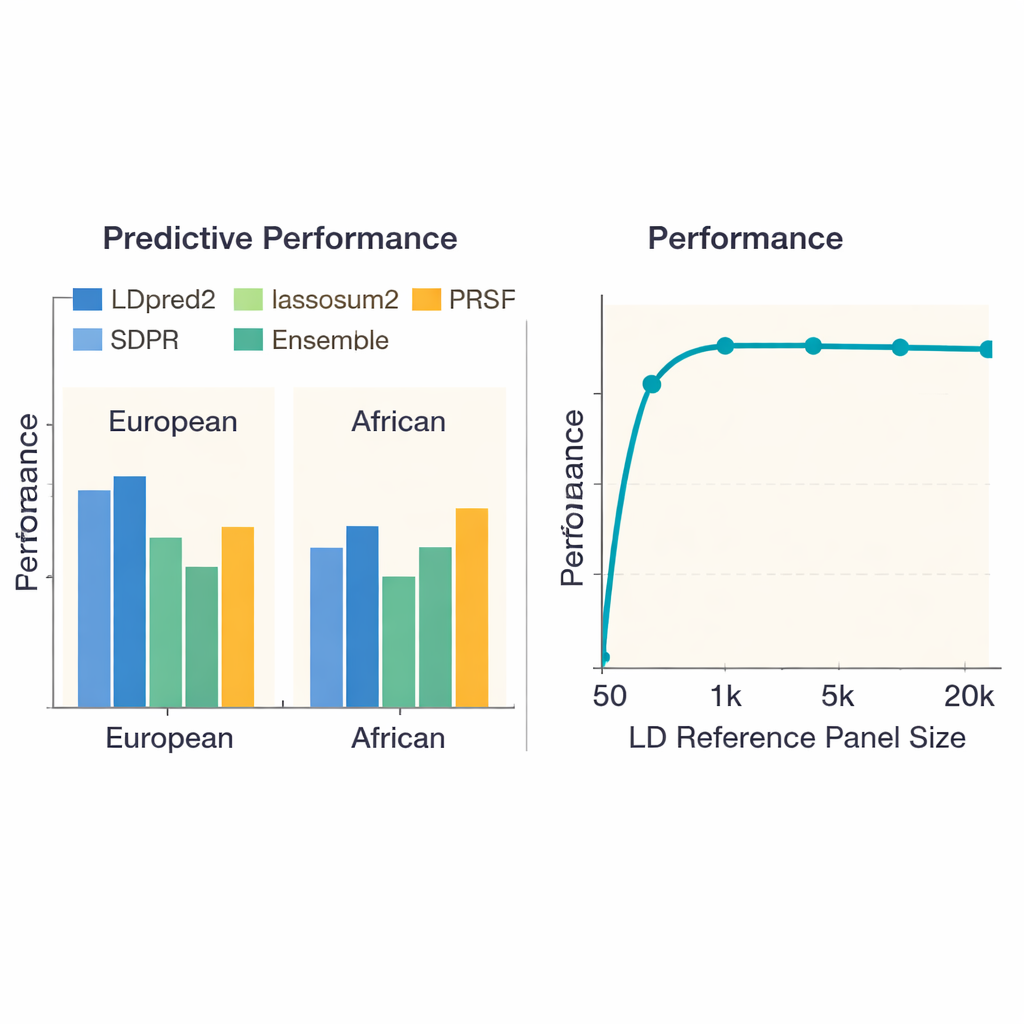
How data choices and computing limits shape scores
The study probed how the size of the reference panel—the set of people used to learn how nearby DNA markers co-vary—affects performance. When this panel was very small (fewer than 1,000 individuals), scores were noticeably less accurate. As the panel grew to about 5,000 people, performance improved sharply and then leveled off, suggesting that ever-larger panels bring diminishing returns. Surprisingly, simply throwing more DNA markers into the mix did not always help: using about 6.6 million variants sometimes made predictions worse than using a carefully chosen set of roughly 1.1 million, likely because extra markers added more noise than useful signal. The authors also documented big differences in computing cost. Simple methods like basic pruning-and-thresholding finished in under an hour per trait, while some Bayesian approaches required hundreds of CPU hours, information that matters for large projects or resource-limited groups.
What this means for future DNA-based prediction
For non-specialists, the core message is that not all DNA risk scores are created equal, and details of how they are built strongly influence who benefits from them. This work provides practical guidance: methods like LDpred2 and well-designed ensembles tend to give the most reliable predictions in large European datasets, and multi-ancestry combinations can outperform more complex cross-population models. At the same time, the drop in accuracy for African-ancestry individuals underlines an urgent need for larger and more diverse genetic studies. By packaging many methods into a single, standardized online platform, PGS-hub lowers the barrier for researchers worldwide to generate and compare polygenic scores, an important step toward using such scores fairly and effectively in medicine.
Citation: Chen, X., Wang, F., Zhao, H. et al. Comprehensive benchmarking single and multi ancestry polygenic score methods with the PGS-hub platform. Nat Commun 17, 2014 (2026). https://doi.org/10.1038/s41467-026-68599-7
Keywords: polygenic scores, genetic risk prediction, PGS-hub platform, multi-ancestry genomics, UK Biobank