Clear Sky Science · en
Iso-orientation bias of layer 2/3 connections unifies spontaneous, visually and optogenetically driven V1 dynamics
How the Brain’s Visual Maps Talk to Each Other
Every time you open your eyes, your brain must weave together bits of information from across the visual field into a single, coherent scene. This paper explores how a thin sheet of cells in the primary visual cortex (V1) accomplishes that feat—whether the brain is quietly at rest, watching a moving pattern, or being poked with light by optogenetic tools. The authors show that a single, simple wiring rule in one cortical layer can explain all of these very different patterns of activity.
Hidden Maps in the Visual Brain
In V1, neighboring patches of cortex prefer different edge orientations—some respond best to vertical lines, others to diagonals or horizontals. Together they form a colorful “orientation map,” like a patchwork quilt of preferred angles. The key layer in this study, called layer 2/3, contains long horizontal connections that link distant patches. Anatomical experiments in several animals suggest a bias: cells tend to connect more strongly to other cells that like the same edge orientation (for example, vertical-to-vertical) than to those that prefer a different one. The authors built a large-scale computer model of V1 that faithfully reproduces this anatomy and the basic responses of real neurons to visual patterns. 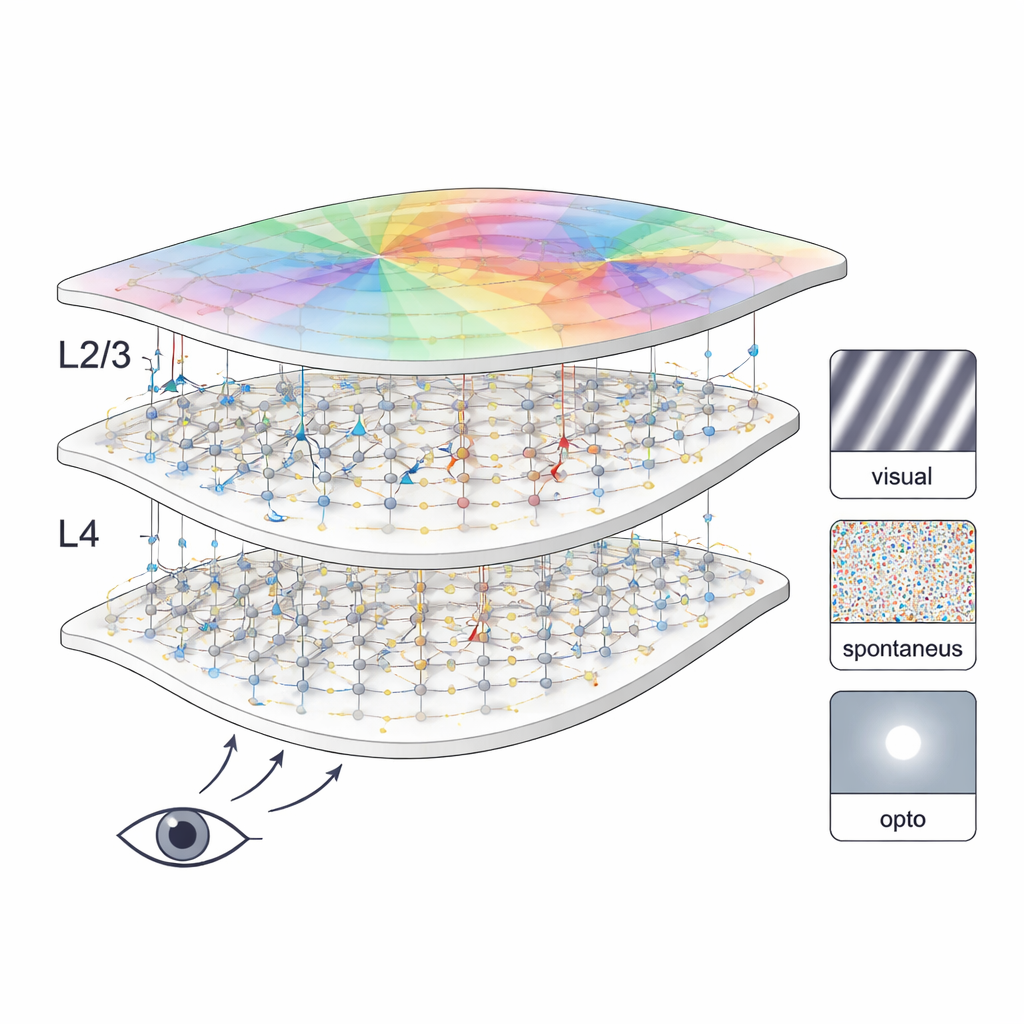
Waves That Follow the Brain’s Preference Lines
Even in darkness, activity in V1 doesn’t sit still. Instead, it forms spontaneous traveling waves that sweep across the cortex. The model reproduces waves similar to those seen in marmoset, cat, and macaque experiments, including their speeds and typical sizes. Crucially, when the authors compared the direction of wave travel to the orientation map, they found that waves tended to move along regions with similar preferred orientations—staying within “same-angle” domains instead of cutting across them. When they removed the iso-orientation bias from layer 2/3 connections in the model, this preference vanished: waves no longer favored paths through like-tuned regions. This shows that a subtle wiring bias can steer seemingly random spontaneous activity.
Resting Activity Reveals the Brain’s Built-In Structure
Experiments have shown that, in young and adult animals, spontaneous activity in V1 is “modular”: certain patches light up together over millimeter distances, and those patterns tend to match the underlying orientation map. The model reproduces this behavior for both excitatory and inhibitory cells. When the authors analyzed correlations in the simulated calcium signal, they could recover a realistic orientation map using only patterns of spontaneous activity—just as has been done in real ferret and cat cortex. Again, the iso-orientation bias in layer 2/3 proved essential: removing it greatly weakened the match between spontaneous activity patterns and the underlying orientation map.
Optogenetic Probes of Cortical Circuits
Optogenetics allows researchers to drive groups of neurons with light, bypassing the eye. The authors coupled their V1 model to a realistic model of an LED array, light propagation in tissue, and light-gated ion channels. They then replayed several published experiments. Uniform full-field stimulation produced variable but modular activity patterns closely resembling spontaneous ones, both in the model and in ferret data. More strikingly, when they stimulated patterns aligned with the intrinsic correlation structure ("endogenous" patterns), responses were stronger and more spatially matched than when using control patterns with similar size and shape but misaligned with the map. In simulations of primate experiments that combine visual and optogenetic stimulation, driving a small column that prefers a given orientation boosted responses in nearby regions tuned to the same orientation and suppressed responses in orthogonal regions—again mirroring real data. 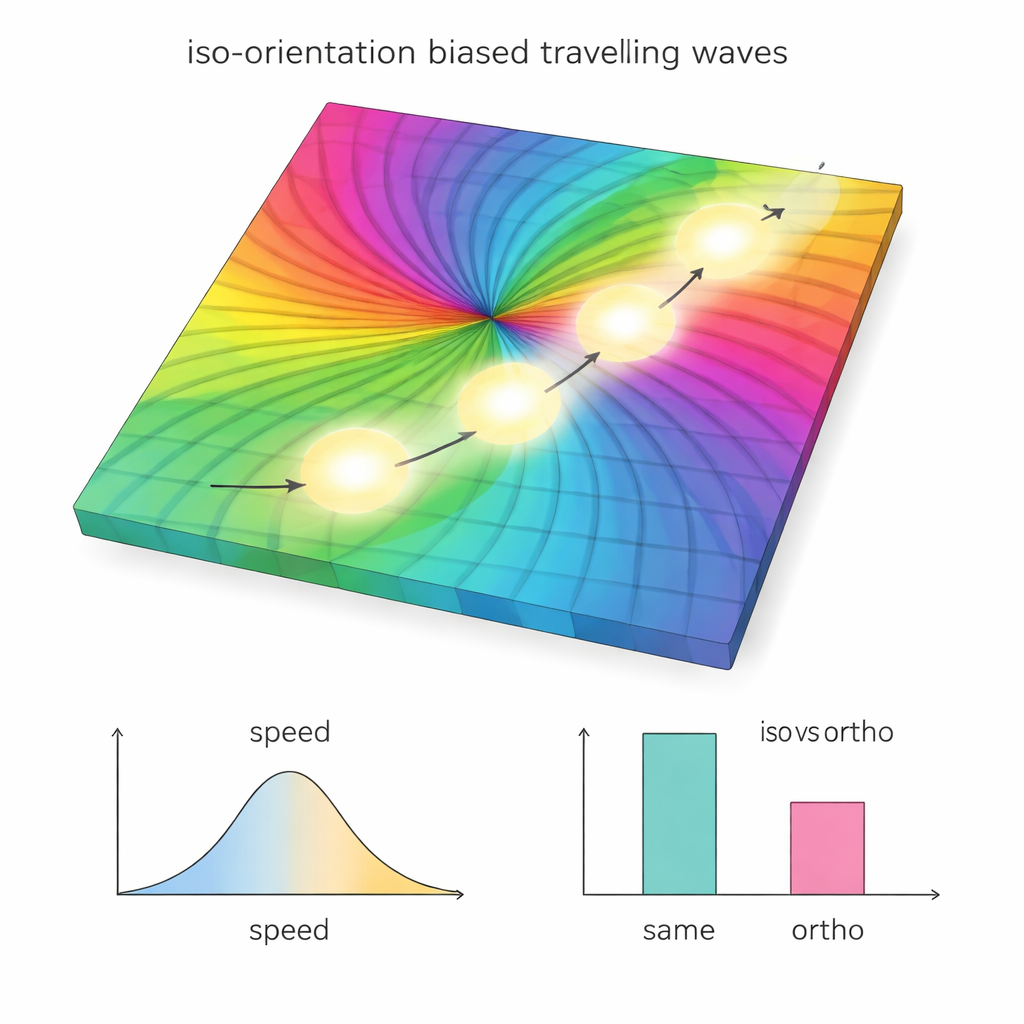
Nonlinear Effects of Stimulating Bigger Regions
By taking advantage of full access to all model neurons, the authors asked a question that is hard to address experimentally: what happens when you gradually enlarge a circular patch of optogenetic stimulation around a given orientation column, while keeping the total light energy constant? They found that activity in the unstimulated surround first increased and became more sharply tuned to the central orientation, but then decreased and became less selective once the illuminated region grew too large. This non‑monotonic behavior arises because iso-orientation connections initially amplify a narrow, aligned pattern, but as more orientations are driven directly, this selective reinforcement weakens and overall inhibition dominates.
Why This Matters for Understanding Vision
To a non-specialist, the key message is that one modest wiring rule—"cells connect more strongly to others that like the same edge orientation"—goes a long way toward explaining how V1 behaves in many situations. The same layer 2/3 circuitry shapes quiet, spontaneous waves, resting activity modules, normal visual responses, and the brain’s reaction to precise optogenetic stimulation. By unifying these diverse phenomena in a single, biologically grounded model, the study suggests that the brain’s intrinsic maps and their biased long‑range connections provide a common framework for integrating visual information across space and across different modes of activity.
Citation: Rózsa, T., Cagnol, R. & Antolík, J. Iso-orientation bias of layer 2/3 connections unifies spontaneous, visually and optogenetically driven V1 dynamics. Nat Commun 17, 1901 (2026). https://doi.org/10.1038/s41467-026-68578-y
Keywords: visual cortex, orientation maps, traveling waves, optogenetics, computational neuroscience