Clear Sky Science · en
Three open questions in polygenic score portability
Why predicting health from DNA is harder than it looks
Doctors and researchers increasingly hope to use DNA-based "polygenic scores" to predict a person’s risk of common conditions such as diabetes, heart disease, or asthma. But these scores often work well only in people who resemble the original research volunteers, usually of European ancestry. This article asks why these predictions fail to "travel" reliably to people with different genetic backgrounds or life circumstances, and what that means for using genetic risk scores fairly in medicine.
What polygenic scores promise—and where they fall short
Polygenic scores combine the tiny effects of many genetic variants across the genome into a single number meant to predict a trait, like height or blood pressure. They are built from huge genome-wide association studies (GWAS) that link DNA markers to traits in hundreds of thousands of volunteers. However, when those scores are applied to new groups of people, their accuracy varies dramatically. Typically, prediction becomes worse the more the new group differs genetically or socially from the original GWAS participants. This is known as the portability problem: a score that works in one context may mislead in another, potentially deepening health inequalities if it is used uncritically.
Looking beyond ancestry: distance on the genetic map
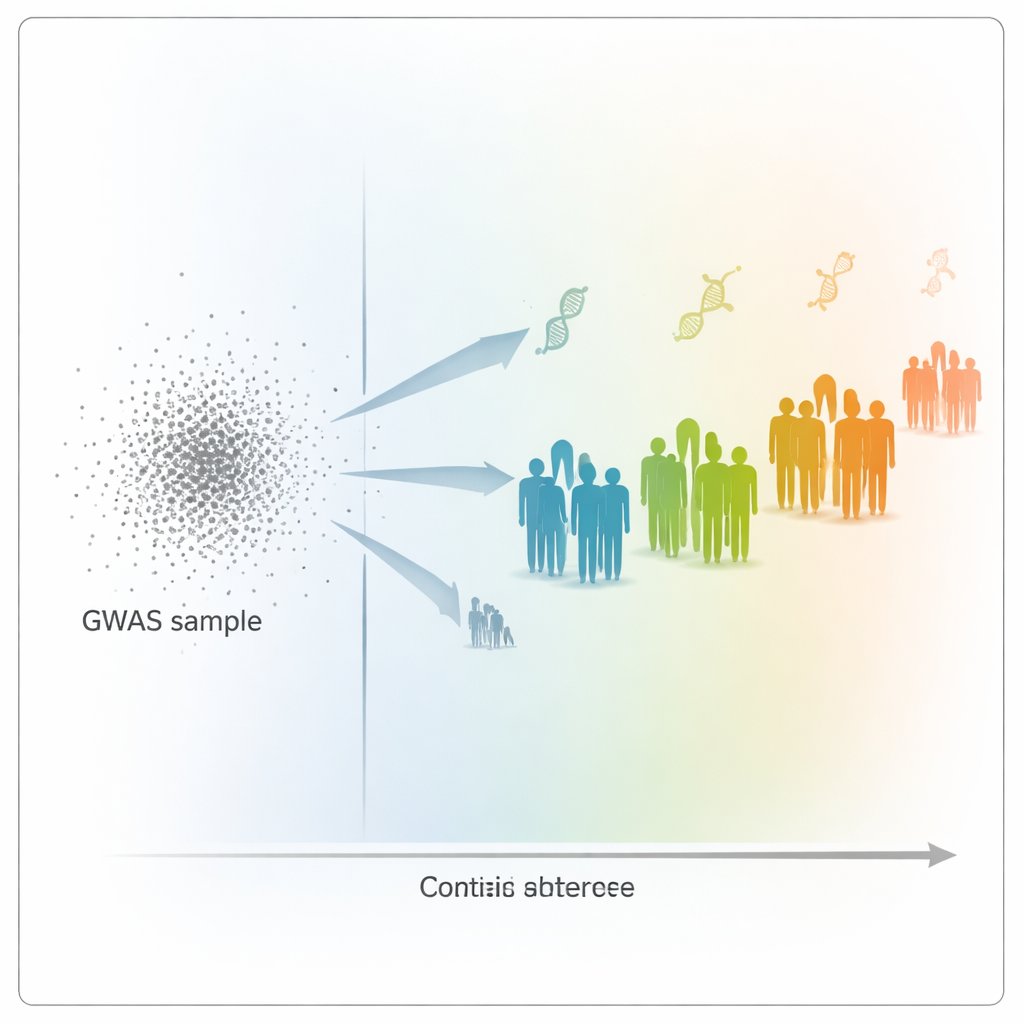
To probe this problem, the authors used data from the UK Biobank, which includes genetic and health information from over 400,000 people. They built polygenic scores for 15 highly heritable traits, such as height, weight, blood cell counts, and cholesterol levels, based on a large group of mainly White British participants. Then they tested how well these scores predicted traits in 69,500 other participants, who spanned a wide range of genetic backgrounds. Instead of assigning people to broad ancestry boxes, the team placed every individual along a continuous "genetic distance" scale: how far each person’s DNA profile lay from the average GWAS volunteer when projected into a genetic map based on principal components.
Prediction power fades—but not in simple or fair ways
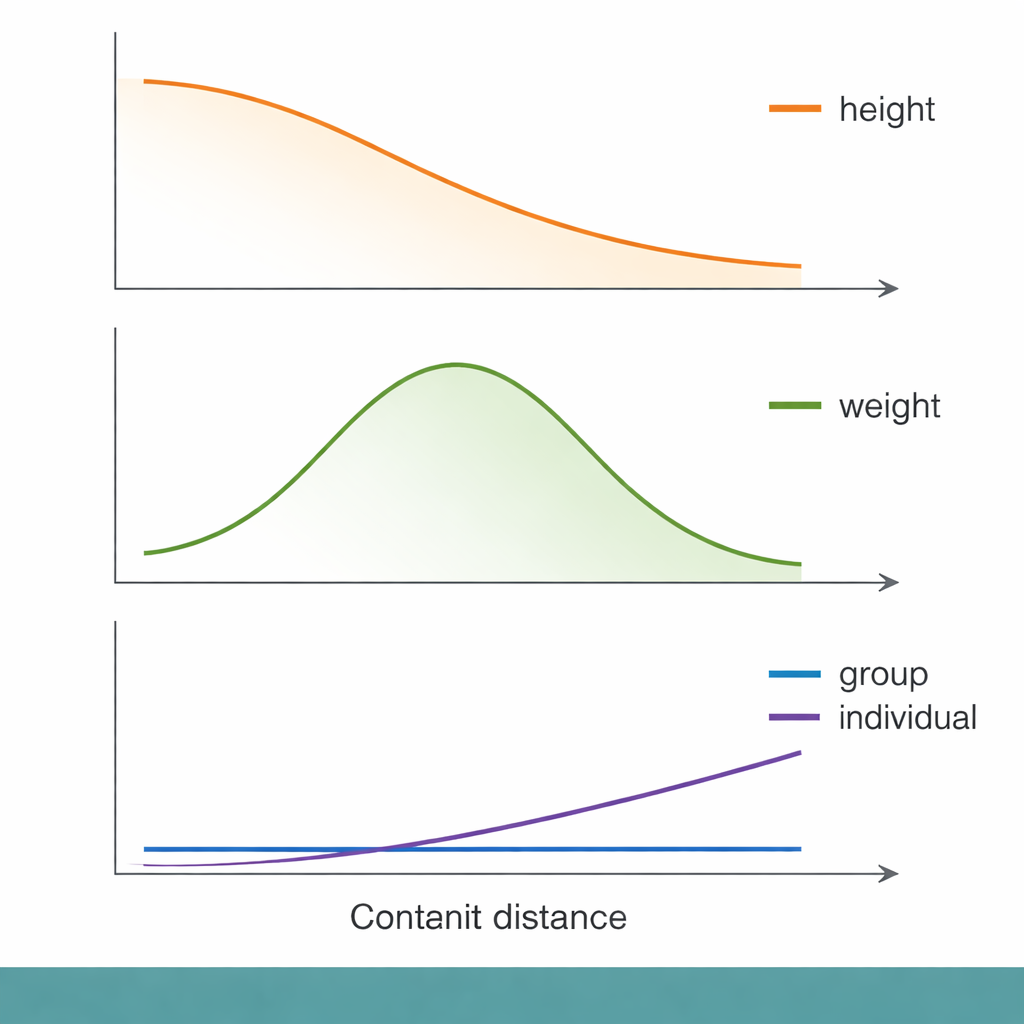
Across this genetic distance scale, some familiar patterns emerged. For height, for example, group-level prediction accuracy declined smoothly as people became more genetically distant from the GWAS group. Yet when the researchers zoomed in to the level of individuals, genetic distance explained only a tiny fraction of how well their traits were predicted. Socioeconomic measures, such as the Townsend Deprivation Index (a neighborhood-level indicator of material disadvantage), performed about as well—or slightly better—at explaining who received poor predictions. In other words, people with lower socioeconomic status tended to get less accurate genetic predictions, even within the same genetic distance band, highlighting that social context can matter as much as DNA for whether a score is useful.
Different traits, different histories, different answers
Not all traits behaved alike. For body weight and body fat, prediction accuracy actually peaked at intermediate genetic distances before declining, breaking the simple "farther means worse" pattern. Immune-related traits, such as white blood cell and lymphocyte counts, showed especially puzzling behavior. For some of these traits, group-level prediction accuracy dropped to nearly zero even for people who were not genetically very distant from the GWAS sample. The authors suggest that immune traits may be shaped by rapidly changing evolutionary pressures—such as past infections—that alter which DNA variants matter in different populations. In these cases, the genetic architecture itself may have shifted enough that a score based on one group becomes almost useless in another.
How we score performance can flip the story
The picture grows even more complicated when we change how "good prediction" is measured. Much prior work has relied on a single statistic called R², which captures how much variation in a trait a score explains in a group. The authors show that other metrics can tell a different story, especially for diseases. For asthma, both precision (how many predicted cases are true cases) and recall (how many true cases are found) declined with genetic distance in similar ways. But for type 2 diabetes, precision stayed fairly constant while recall actually increased with distance—meaning the score found a larger share of true cases in more distant groups, even though it was built in a closer group. Depending on whether a clinic cares more about catching all high-risk patients or about avoiding false alarms, one might come to opposite conclusions about how portable the score is.
What this means for using DNA scores in real life
Overall, the study argues that we cannot judge the usefulness of polygenic scores by looking only at broad ancestry labels or a single accuracy number. Individual prediction quality depends on a mix of factors: subtle patterns of genetic similarity, the evolutionary history of each trait, the environments and social conditions people live in, and the particular way the score and its performance metric are chosen. For polygenic scores to be applied fairly and effectively in medicine, researchers will need better ways to capture fine-grained genetic structure, to model social and environmental influences, and to match evaluation metrics to real-world decisions. Until then, genetic risk scores should be used cautiously, with an eye toward the people—and contexts—for which they work poorly as well as those for which they shine.
Citation: Wang, J.Y., Lin, N., Zietz, M. et al. Three open questions in polygenic score portability. Nat Commun 17, 942 (2026). https://doi.org/10.1038/s41467-026-68565-3
Keywords: polygenic scores, genetic prediction, health disparities, genetic ancestry, precision medicine