Clear Sky Science · en
Best practices and tools in R and Python for statistical processing and visualization of lipidomics and metabolomics data
Why turning lab numbers into clear pictures matters
Modern instruments can now measure thousands of tiny molecules—lipids and other metabolites—in a single drop of blood or tissue. These measurements hold clues about disease risks, treatment responses, and how our bodies react to diet or age. But the raw output is not a ready-made answer: it is a huge table of numbers that must be cleaned, analyzed, and turned into understandable pictures. This article explains how researchers can use two popular programming languages, R and Python, to do this reliably, transparently, and with publication-quality graphics.
From chemical measurements to complex data tables
In lipidomics and metabolomics, mass spectrometry and chromatography generate large datasets where each row is a sample and each column is a molecule. These tables rarely behave like tidy textbook examples. They contain missing values, outliers, and skewed distributions where a few molecules show extremely high levels. Concentrations can span several orders of magnitude, and may be influenced by age, sex, diet, medications, daily rhythms, and technical issues such as instrument drift or batch effects. International expert groups have issued guidelines to standardize how samples are collected, processed, and reported, but even with good laboratory practice, careful statistical processing is still essential to extract true biological signals from this noisy background.
Cleaning and preparing the numbers
Before any comparison between healthy and diseased groups is meaningful, the data must be prepared. The review describes how missing values arise—through random mishaps, instrument limitations, or signal interference—and explains when they can safely be ignored, when they should be re-measured, and how they can be sensibly estimated (imputed) using methods such as k-nearest neighbors, random forests, or simple low-value substitution. Next, the authors outline normalization strategies that reduce unwanted variation, for example by correcting batch effects with quality control samples or adjusting for differences in sample amount. They then discuss transformations like logarithms—which tame long right-hand tails in the data—and scaling methods that put all molecules on a comparable footing so that highly variable compounds do not dominate later analyses. 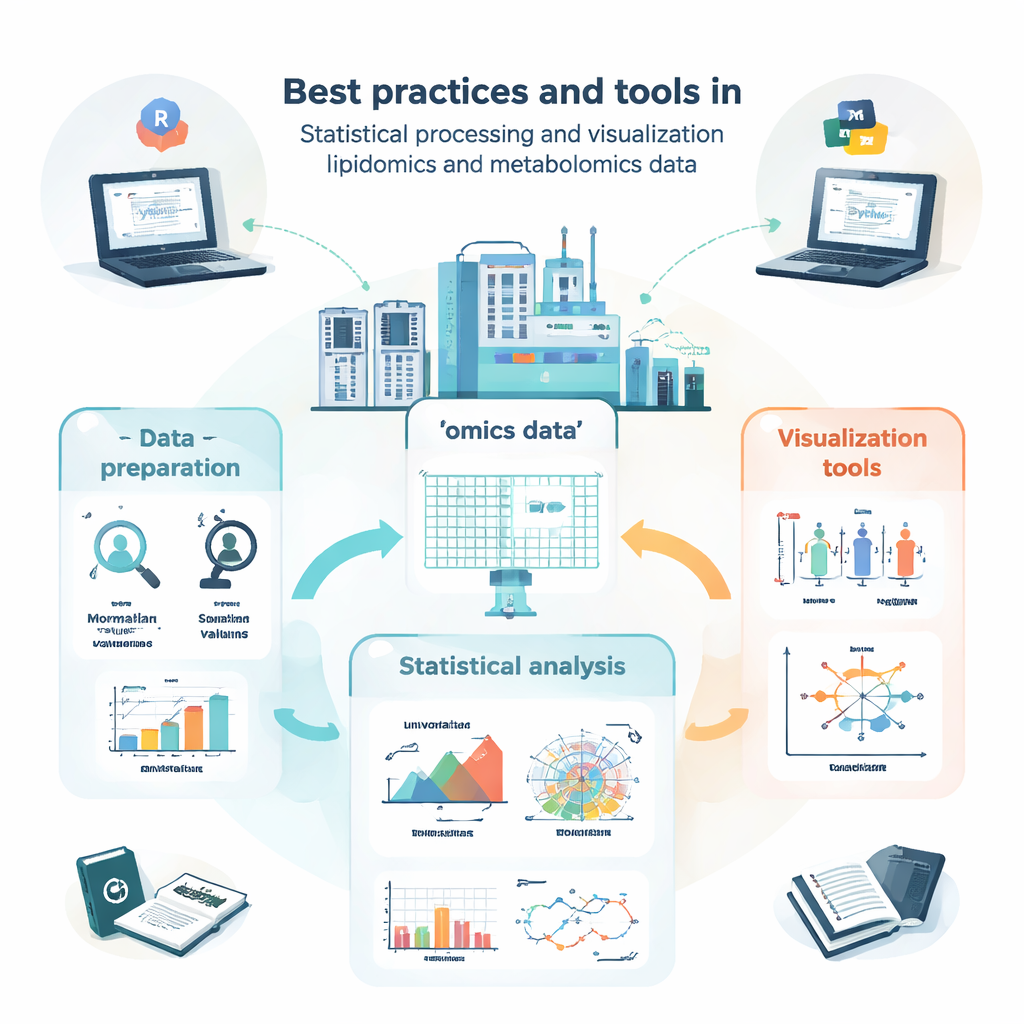
Statistical tests and visual stories
Once the data are properly prepared, a range of statistical tools comes into play. For single molecules, researchers can compute fold changes and use classic tests such as the t-test or its non-parametric counterparts (like the Mann–Whitney test) to ask whether levels differ between groups. For comparisons involving several groups, methods such as ANOVA or the Kruskal–Wallis test are introduced, accompanied by post hoc procedures to pinpoint which groups differ. The power of these tests is unlocked when their results are visualized clearly. The article highlights box plots (including improved versions for skewed data), violin plots, and volcano plots that combine effect size and statistical significance. For lipids, more specialized visuals are described, such as lipid networks that show coordinated changes across whole classes, and fatty acyl chain plots that reveal patterns in carbon chain length and saturation.
Seeing patterns in many variables at once
Because each sample can have hundreds or thousands of measured molecules, multivariate methods are crucial. The review explains how principal component analysis (PCA) compresses this complexity into a few new axes that capture the main directions of variation, enabling quick checks for group separation, batch effects, or analytical stability. More advanced non-linear methods, including t-SNE and UMAP, can reveal subtle clusters and structures in high-dimensional space. For situations where the goal is to classify samples—for example, distinguishing patients from controls—the authors describe supervised approaches based on Partial Least Squares and its orthogonal extension (PLS-DA and OPLS-DA). These methods link molecular profiles to sample labels, support feature selection, and are often summarized with score plots, loading plots, and receiver operating characteristic curves.
Practical toolkits in R and Python
To help beginners move from theory to practice, the article surveys a wide ecosystem of software packages. In R, collections such as tidyverse and tidymodels simplify data wrangling and modeling, while ggplot2 and add-on packages like ggpubr, ggstatsplot, and tidyplots make it easier to generate publication-ready figures. Specialized libraries handle PCA, clustering, and PLS-based models, and Bioconductor packages support complex heat maps and interactive graphics. In Python, pandas provides table handling, while matplotlib, seaborn, and plotly cover visualization, and scikit-learn offers a broad suite of multivariate methods. Throughout, the authors emphasize step-by-step examples made available in an accompanying GitBook, so readers can reproduce workflows and adapt them to their own data. 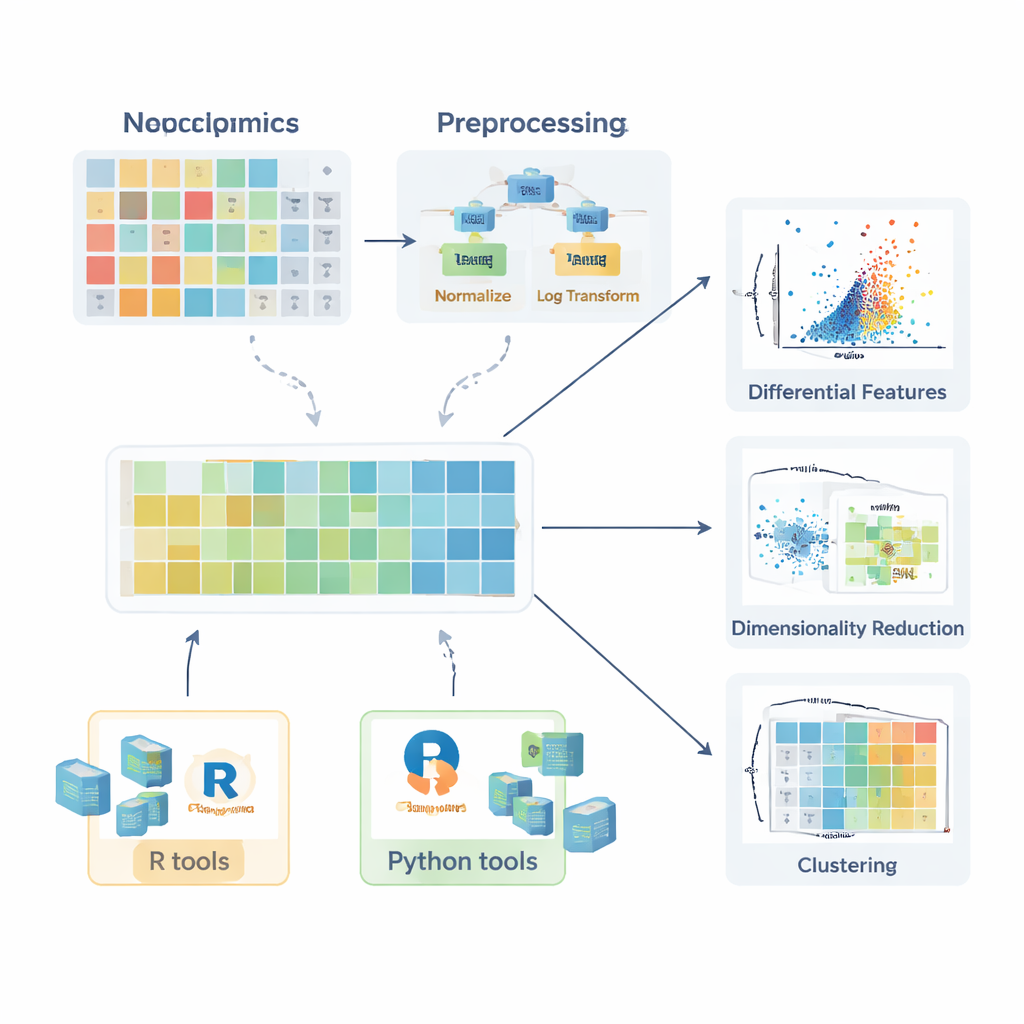
Turning complex chemistry into reliable insight
The article concludes that the real promise of lipidomics and metabolomics lies not just in powerful instruments, but in how thoughtfully their output is processed and visualized. By following good statistical practice, using open and well-documented tools in R and Python, and relying on shared code examples, researchers can build robust and reproducible pipelines. This improves the chances that patterns found in tiny molecules will translate into trustworthy biomarkers, better understanding of disease mechanisms, and more personalized approaches to medicine that ultimately benefit patients.
Citation: Idkowiak, J., Dehairs, J., Schwarzerová, J. et al. Best practices and tools in R and Python for statistical processing and visualization of lipidomics and metabolomics data. Nat Commun 16, 8714 (2025). https://doi.org/10.1038/s41467-025-63751-1
Keywords: lipidomics, metabolomics, data visualization, R programming, Python