Clear Sky Science · en
Combining spatial transcriptomics with tissue morphology
Peering Inside Tissues in Two Different Ways
Doctors and scientists increasingly want to know not just which genes are active in a tissue, but exactly where they are switched on. At the same time, hospital microscopes already capture rich images of tissue structure that pathologists use every day. This article explains how a new field is trying to connect these two views — detailed gene activity maps and ordinary microscope pictures — and why that marriage could lead to earlier diagnoses, better cancer grading, and deeper insight into how diseases develop and spread.
From Scattered Cells to Maps of Gene Activity
For years, powerful “omics” methods required tissues to be ground up into a mix of single cells, which destroyed information about where each cell came from. Spatial transcriptomics changed that by measuring gene activity while keeping each cell’s position in the tissue. The result is a grid of spots, each with a gene expression profile and precise coordinates. On its own, this spatial gene data has already revealed new patterns of cellular diversity and disease architecture. But it does not change once it is measured, and repeating the experiment is expensive. In contrast, tissue images stained with standard dyes, such as the widely used hematoxylin and eosin (H&E), are cheap and abundant, and contain visual clues about cell shape, density, and tissue organization.
Two Ways to Combine Pictures and Genes
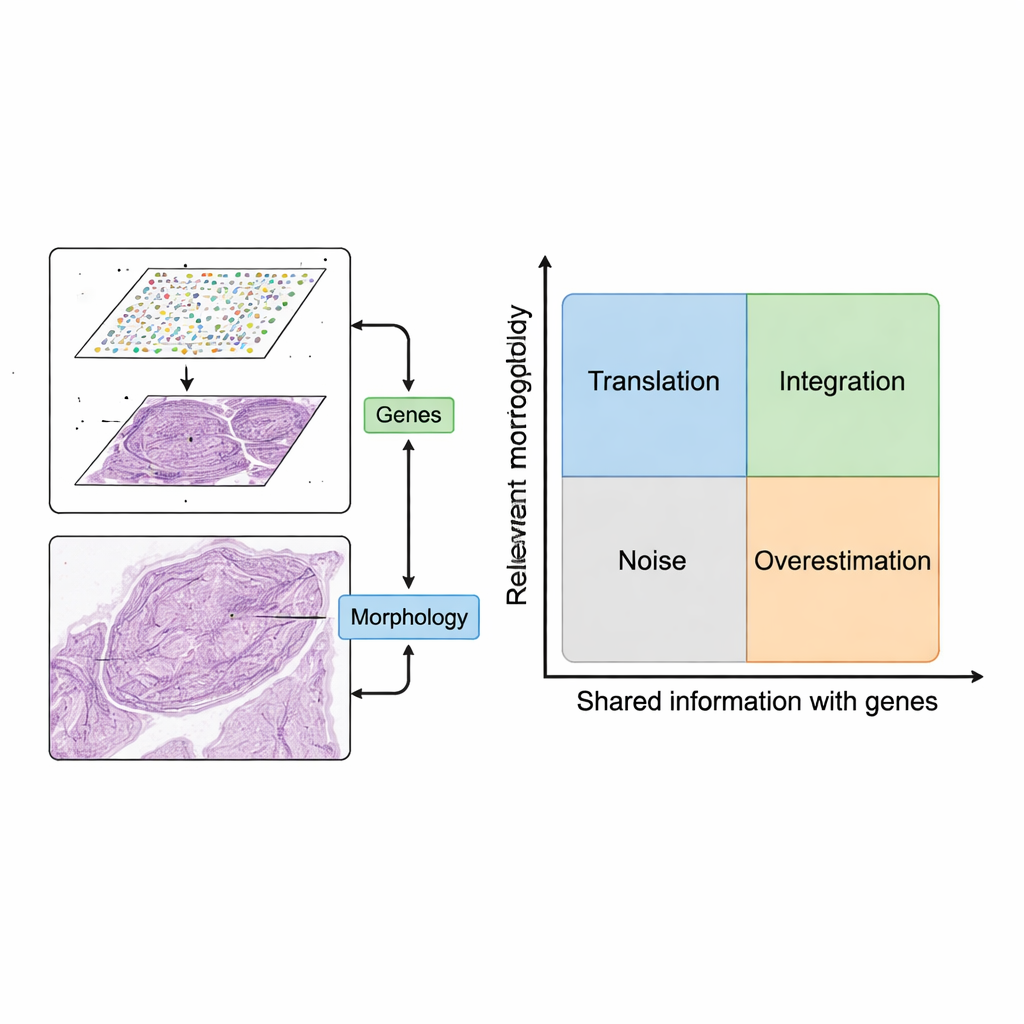
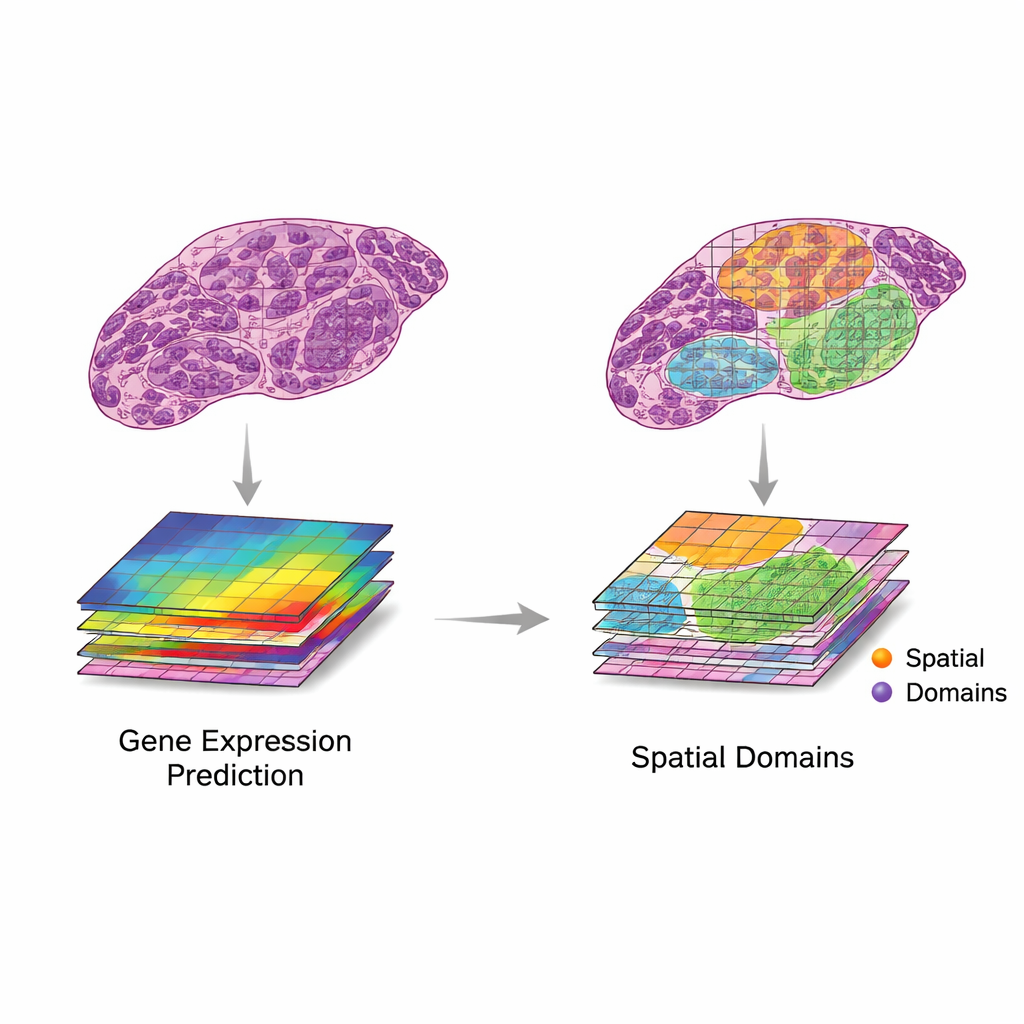
The review proposes a simple but powerful framework for using these two data sources together. First, image patches are paired with nearby gene expression spots. Then, computer models extract features from images — patterns that capture shape, texture, and organization — and compare them with patterns in gene expression. The authors describe two desirable scenarios. In “translation,” image features closely track relevant gene activity, allowing models to predict which genes are on using only the tissue image. This can be used to fill in missing gene measurements, reach finer resolution than the original grid, or infer gene activity from routine clinical slides without doing extra lab work. In “integration,” image features capture useful information that gene data misses, such as slow structural changes or subtle tissue organization, helping define clearer regions or “domains” within a tissue.
When Extra Information Helps — and When It Hurts
Not every image feature is worth using. The authors introduce a conceptual map with two axes: how relevant an image feature is for the biological question, and how much it overlaps with gene information. Features that are neither relevant nor related to genes amount to noise, such as staining artifacts. Features that track gene patterns but are tied to unimportant genes (like basic housekeeping genes) can make models look good on paper while adding little clinical value. By organizing methods into four quadrants — translation, integration, noise, and overestimation — the framework clarifies when combining images and genes truly adds insight, and when it simply repeats or obscures what is already known.
Current Tools, Tests, and Growing Pains
A fast-moving wave of artificial intelligence methods now try to perform translation and integration on real data. Early systems relied on convolutional neural networks, while newer ones use transformers, graph neural networks, and multi-scale models that can take in details from tiny cell structures up to whole-slide context. These methods have been used to predict gene activity from H&E images, generate super‑resolution maps, and help identify tissue regions with distinct behavior. To judge performance, researchers rely on statistical measures such as correlation between predicted and observed gene levels, or agreement between AI-defined regions and expert pathologist labels. However, datasets are still small and varied, and comparison across studies is difficult. Many reported gains may reflect overfitting, or success on genes and patterns that matter little in the clinic.
Where This Could Lead
The authors conclude that combining spatial gene maps with tissue images is a promising but still early-stage endeavor. Today’s models often achieve only moderate accuracy and have not yet proven ready for routine medical use. Future progress will likely come from better image features, especially large “foundation models” trained on millions of pathology slides, and from focusing on genes and patterns that truly influence patient care. Carefully designed integration could one day reveal early warning signs of disease by spotting mismatches between what the tissue looks like now and what its genes predict will happen next. In short, this work lays out a roadmap for turning routine microscopic images into rich, gene-informed maps that help doctors understand and treat disease more precisely.
Citation: Chelebian, E., Avenel, C. & Wählby, C. Combining spatial transcriptomics with tissue morphology. Nat Commun 16, 4452 (2025). https://doi.org/10.1038/s41467-025-58989-8
Keywords: spatial transcriptomics, tissue morphology, digital pathology, gene expression prediction, imaging AI