Clear Sky Science · en
Integrative spatial profiling pipeline for determining TME architectures in archival clinical specimens using CmTSA superplex technology
Why the hidden landscape around tumors matters
Cancers do not grow in isolation. They are surrounded by a bustling neighborhood of immune cells, support cells, blood vessels and scar-like tissue that together form the tumor’s “microenvironment.” This paper introduces a practical way to map that hidden landscape in detail using standard hospital tissue samples. By revealing which kinds of cells sit next to each other, and how they organize into helpful or harmful neighborhoods, the method could help doctors better predict how a patient’s cancer will behave and which treatments are most likely to work.
Seeing more in everyday hospital samples
Most clinical cancer samples are preserved as thin slices of wax-embedded tissue, known as FFPE blocks, which can be stored for years. These are a goldmine for research, but a technical problem has held scientists back: such samples glow with natural background fluorescence that drowns out the faint signals from many important proteins. The authors solved this by combining intense, carefully tuned light with a mild chemical treatment to selectively erase that background glow without damaging the tissue or the protein targets. This hybrid optical and chemical “bleaching” step sharply boosts image clarity, allowing researchers to detect weak protein signals that would otherwise be lost.
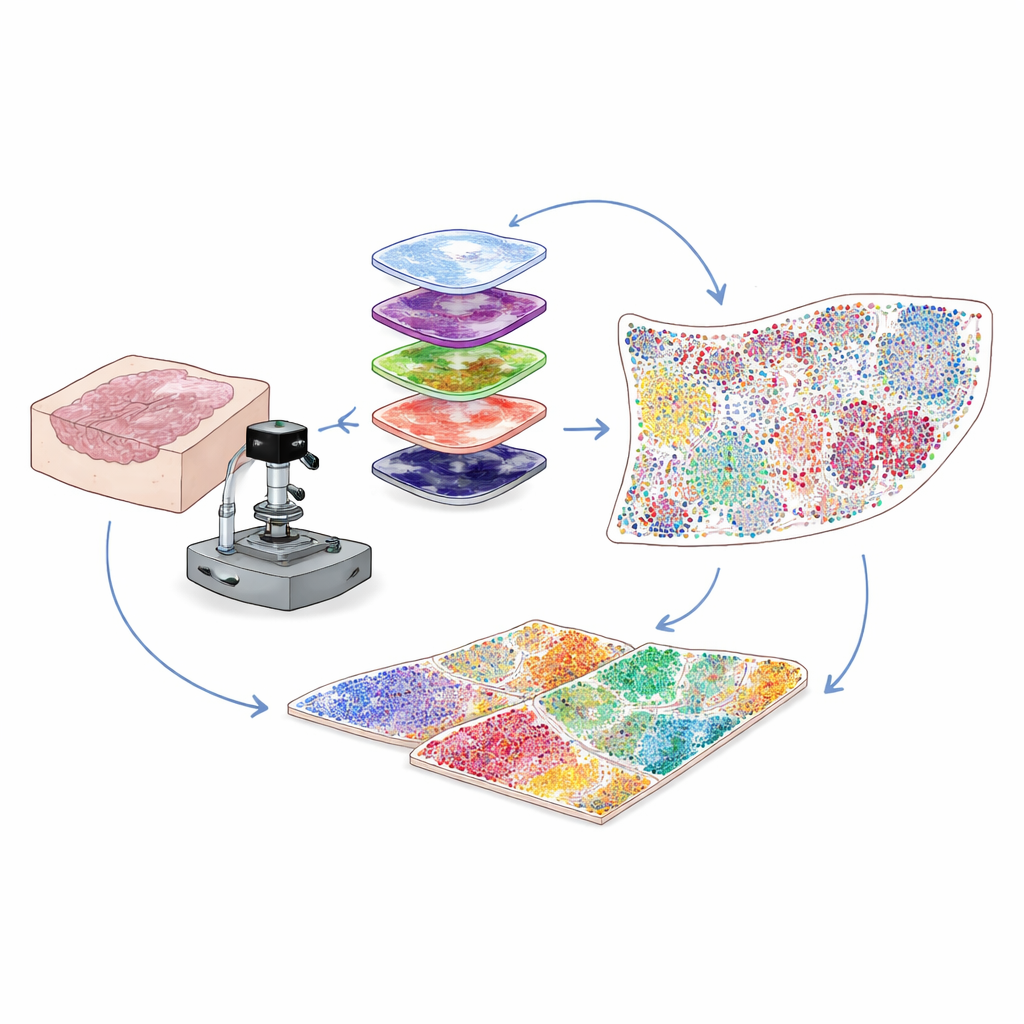
Painting dozens of protein tags on the same slice
To understand which cells are present and what they are doing, scientists stain tissues with antibodies that latch onto specific proteins. Traditional multiplex methods either struggle with low signal strength for rare proteins or can only track a limited number of markers at once. Here, the team uses an approach called cyclic tyramide signal amplification. In each round, a small set of markers is stained and enzymatically “developed” into bright, permanently attached fluorescent spots. The antibodies are then gently stripped away while the signal remains, the background is re-bleached, and the next set of markers is added. By repeating this cycle many times and aligning the images using the constant signal from cell nuclei, they can reliably visualize 30 to 60 different proteins on a single tissue slice, across an entire slide, at single-cell resolution.
Turning colorful images into a cell-by-cell atlas
High-plex images contain millions of pixels, far more than a human could analyze by eye. The authors therefore build a computer-vision pipeline that first finds and outlines every cell nucleus using deep-learning tools originally developed for general cell segmentation. Then, based on where each protein’s fluorescence appears—on the membrane, in the cytoplasm, or in the nucleus—and on sets of logical rules, each cell is assigned to a type or subtype, such as tumor cell, helper T cell, killer T cell, B cell, fibroblast or others. The output is a digital table listing, for every cell on the slide, its identity and its exact coordinates. This transforms a complex image into a quantitative map of who is where within the tumor microenvironment.
Revealing cellular neighborhoods that shape outcome
Cells rarely act alone; what matters is which neighbors they have. To capture this, the researchers test different ways to define local neighborhoods around each cell and settle on a radius-based network approach. Imagine drawing a small circle—about the thickness of a human hair—around every cell and listing who lives inside it. By grouping cells whose surrounding circles have similar mixes of neighbors, the method identifies recurring “functional niches,” such as immune-rich zones, fibroblast-heavy barriers, or tumor-dominated regions. Applying this strategy to colon tissue shows that radius-based neighborhoods align better with known anatomical structures than alternative methods. In cervical cancer samples from patients with good versus poor outcomes, the team finds that immune-cell–rich niches cluster near the tumor edge in patients who fare well, whereas patients with worse outcomes show thick fibroblast-dense zones that encase tumor cells and appear to wall off attacking immune cells.
From spatial maps to tailored treatment
By combining high-quality, affordable staining of many proteins with robust image analysis, this work delivers an end-to-end pipeline that can be applied to large numbers of standard hospital samples. The method turns preserved tissue into detailed maps of how tumor, immune, and stromal cells arrange themselves and interact. For lay readers, the takeaway is that not just the types of cells, but their precise neighborhood patterns, matter for how a cancer behaves. This platform may help researchers pinpoint protective immune hotspots, identify suppressive cellular barriers, and ultimately support more accurate prognosis and more finely tuned immunotherapy strategies.
Citation: Xiao, C., Zhou, R., Chen, Q. et al. Integrative spatial profiling pipeline for determining TME architectures in archival clinical specimens using CmTSA superplex technology. Cell Discov 12, 16 (2026). https://doi.org/10.1038/s41421-026-00874-9
Keywords: tumor microenvironment, spatial proteomics, multiplex imaging, cancer immunology, single-cell analysis