Clear Sky Science · en
Graph-enhanced clustering of late modern churches via multi-dimensional semantic feature integration
Why church maps and data science matter
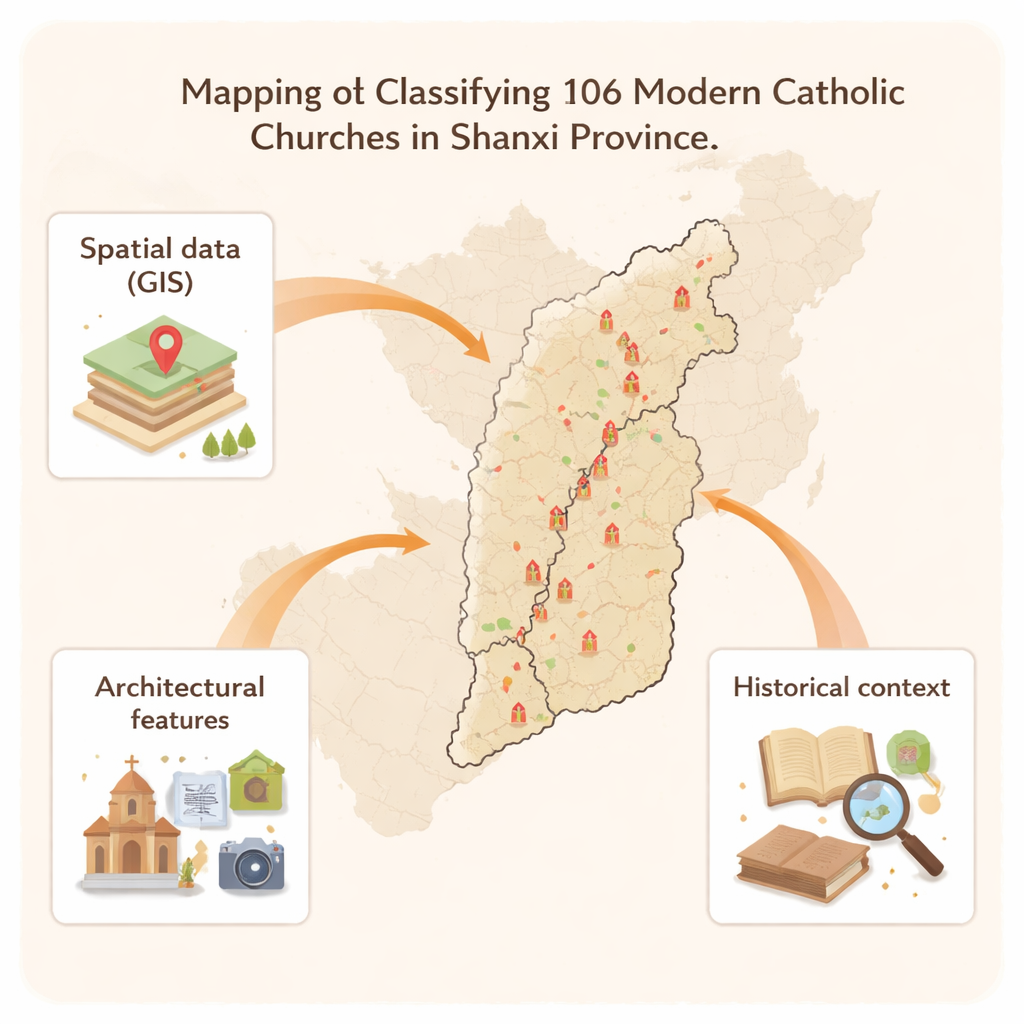
Across the hills and river valleys of Shanxi Province in northern China, more than a hundred Catholic churches quietly record a century of cultural exchange between China and the West. This study shows how modern mapping tools and artificial intelligence can be combined to read those buildings as a network, revealing where they were built, how their designs evolved, and what that says about faith, geography, and craft traditions in a changing China.
Churches as stories in stone and brick
Each church in this study is treated as a small bundle of clues. The researchers documented when it was built, which missionary period it belongs to, what its floor plan looks like, how its façade is styled, and what kind of structure holds it up—from brick walls and timber roofs to cave-like spaces carved into loess cliffs. They also precisely mapped each site using GPS, digital elevation models, and river data. In total, 106 churches built between about 1840 and 1949 were described through 23 different traits, creating a rich portrait of how Western religious architecture met local Chinese building practice.
From paper maps to intelligent networks
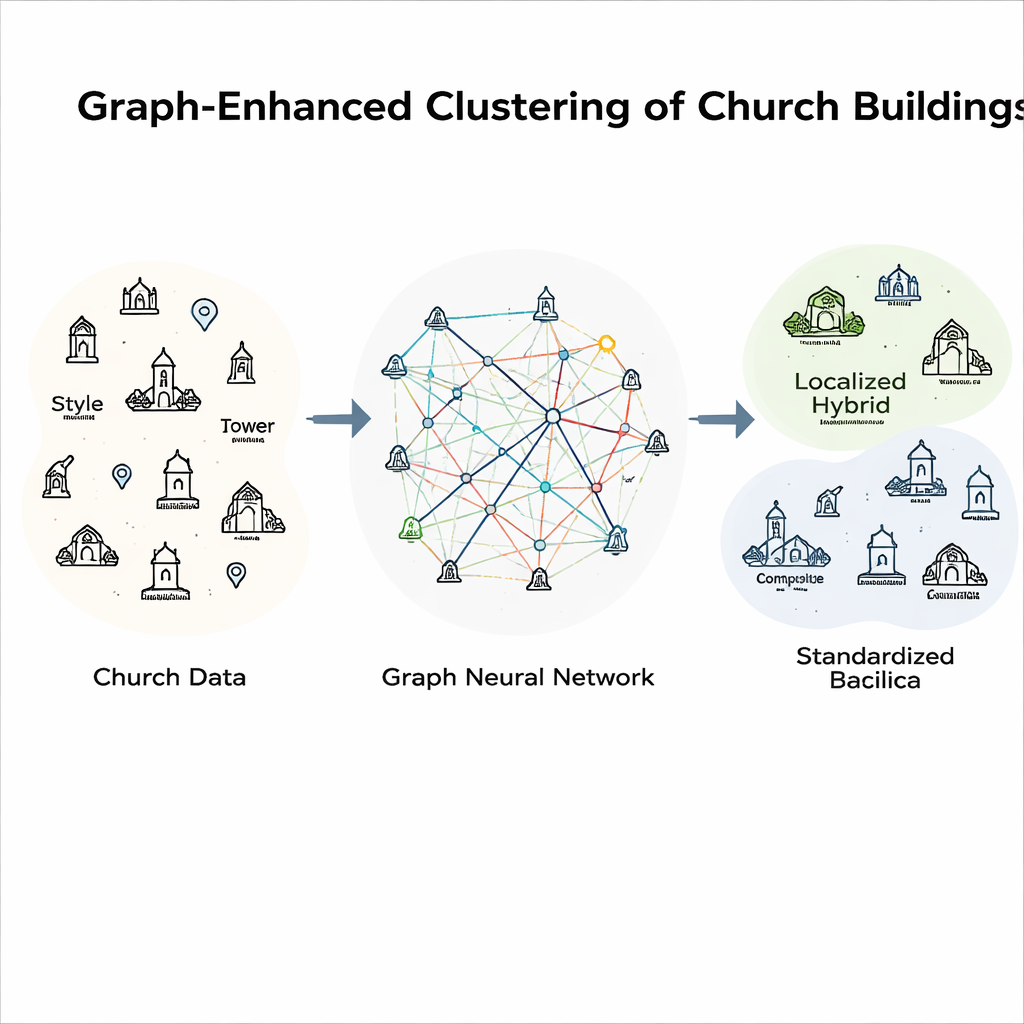
Listing these traits in a table is not enough to see deeper patterns. Instead, the team built a “graph,” a kind of smart map where each church becomes a point (a node) and points are linked if they share important similarities. Two churches might be connected because they both use a basilica plan, share a Gothic façade, sit in the same river basin, or belong to the same kind of structural system. A specialized neural network called GraphSAGE then passes information along these links, allowing each church to be described not only by its own features, but also by those of its neighbors in this network of resemblances.
Letting the data sort itself into families
Once these enriched descriptions were learned by the network, the researchers used an unsupervised clustering method, which asks the computer to group churches that are most alike without telling it in advance which types to expect. They carefully tested how deep the network should be and how best to mix different kinds of relationships—such as style, structure, and water proximity—so that the resulting groupings would be both stable and meaningful. They also compared several classic clustering techniques and found that a simple center-finding approach worked best on these network-based features, giving clear, well-separated categories.
Three main ways churches took shape
The analysis revealed three broad families of churches that trace Shanxi’s path from local adaptation to more standardized Western forms. The first, called “Localized Hybrid Adaptation,” includes many early sites along major rivers. These buildings weave together Romanesque or Gothic details with traditional Chinese façades, cave dwellings, and courtyard layouts, showing foreign worship practices fitted carefully into local materials and skills. The second, “Highland Western Composite,” spreads into higher valleys and mixes several Western styles and plans, balancing imported church layouts with challenging terrain. The third, “Standardized Basilica Expansion,” appears later and is concentrated in central basins, where brick-and-timber basilicas with Romanesque and Gothic looks form a more uniform and institutional church landscape.
What this means beyond Shanxi
For non-specialists, the result is a kind of x-ray vision for architectural history. By turning buildings and their settings into a connected dataset, this study shows how small, scattered, and uneven records can still yield a coherent picture of how religious architecture spread, adapted, and matured over time. The same graph-and-cluster approach could be applied to other kinds of heritage—from village houses to factory complexes—helping historians and planners see not just isolated landmarks, but living patterns that link place, technology, and culture.
Citation: Kang, F., Li, W., Li, L. et al. Graph-enhanced clustering of late modern churches via multi-dimensional semantic feature integration. npj Herit. Sci. 14, 100 (2026). https://doi.org/10.1038/s40494-026-02360-7
Keywords: architectural heritage, church architecture, graph neural networks, spatial clustering, Sino-Western cultural exchange